France and the United States: as many poor people, by opposite routes
With the same poverty line for everyone, France and the United States have the same share of poor people, about 16%. One is richer, the other redistributes more. And Switzerland does better than both.
Which has more poor people: France, with one of the most expensive welfare states in the world, or the United States, richer but less protective? The answer depends first on what we call “poor”.
Two ways to count the poor
Europe's official poverty rate is relative: a person is poor if they earn less than 60% of the income of the middle of their country's ladder. It measures the gap with the rest of the population, not living standards. By this measure, Switzerland (19%) has more poor people than France (16%), even though low-income Swiss people live much better than low-income French people.
To compare living standards, you need an absolute line, the same everywhere. The World Bank publishes one suited to rich countries: 30 dollars a day per person, about $900 a month, adjusted for price differences between countries. That is the line used here.
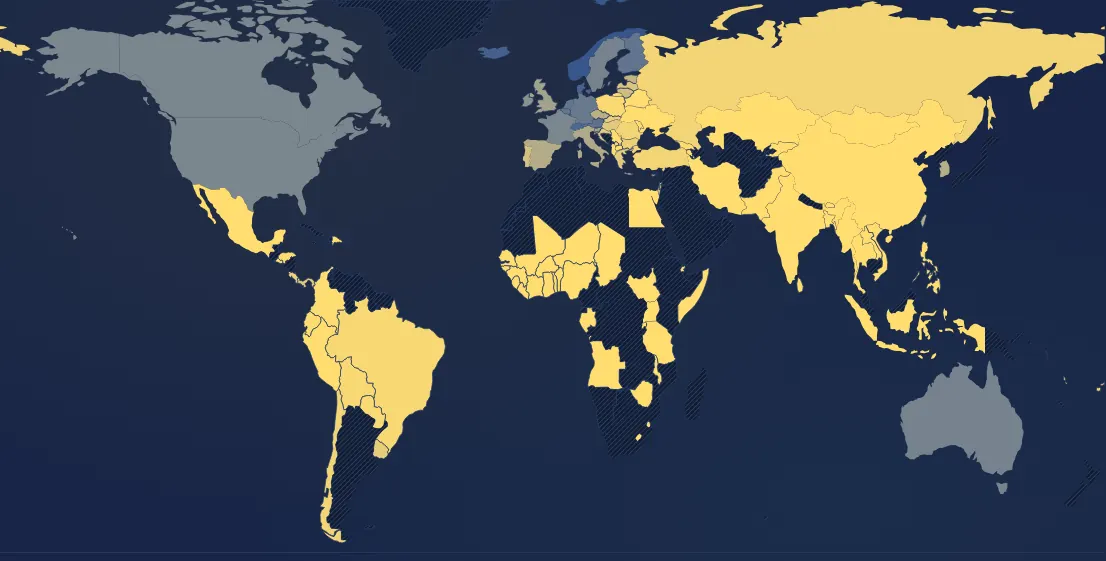
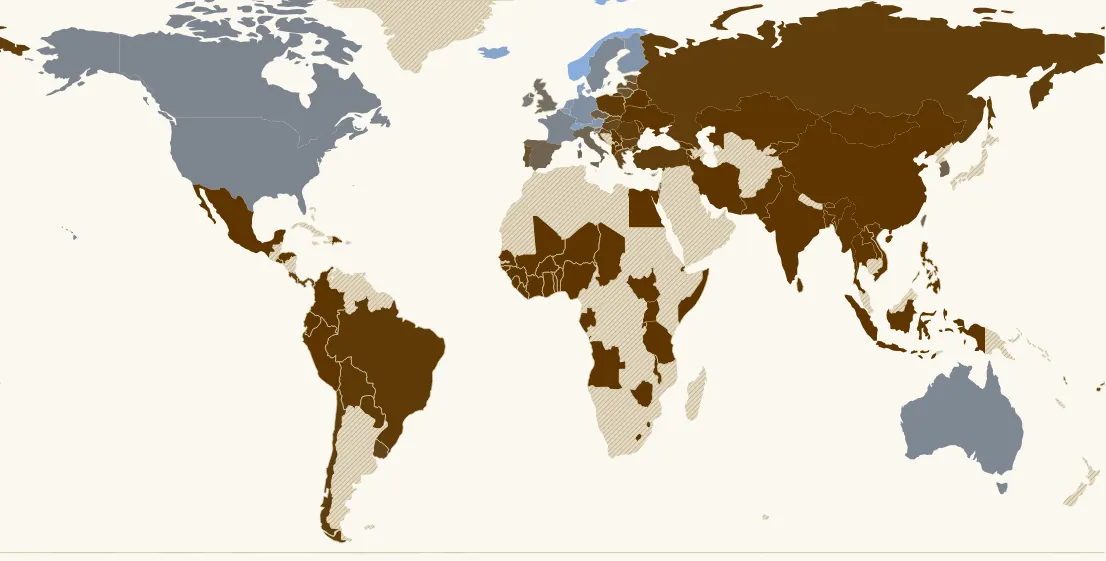
Same result, two routes
Below this line, around 2019:
| Country | Below $30 a day | GDP per person | Public social spending | Gini index |
|---|---|---|---|---|
| Switzerland | 9% | $79,600 | 16% of GDP | 33 |
| France | 16% | $53,400 | 31% of GDP | 32 |
| United States | 16% | $69,100 | 18% of GDP | 41 |
France and the United States reach the same figure by opposite routes.
- The United States is richer. The income of the household “in the middle” is about $65 a day per person, against $50 in France: a third more. But incomes are much more unequal (Gini of 41 against 32), and the bottom of the ladder falls behind: 2.2% of Americans live on less than $10 a day, against 0.3% of French people.
- France is less rich, but redistributes more. It devotes 31% of its GDP to social protection (pensions, health, benefits, minimum income), against 18% in the United States. This spending lifts the bottom of the ladder, without fully making up for a lower income level.
And Switzerland?
Switzerland does better than both, with 9% below the line. First, it is much richer (nearly $80,000 per person). Its social protection looks low, 16% of GDP, but the figure is misleading: health insurance and pension funds are mandatory but private there, so they are not counted as public spending. Its incomes are barely more unequal than France's. High wealth and moderate inequality: that is the combination that gives the fewest poor people. Norway (6%) and Denmark (8%) do the same, with a large welfare state.
What other rich countries say
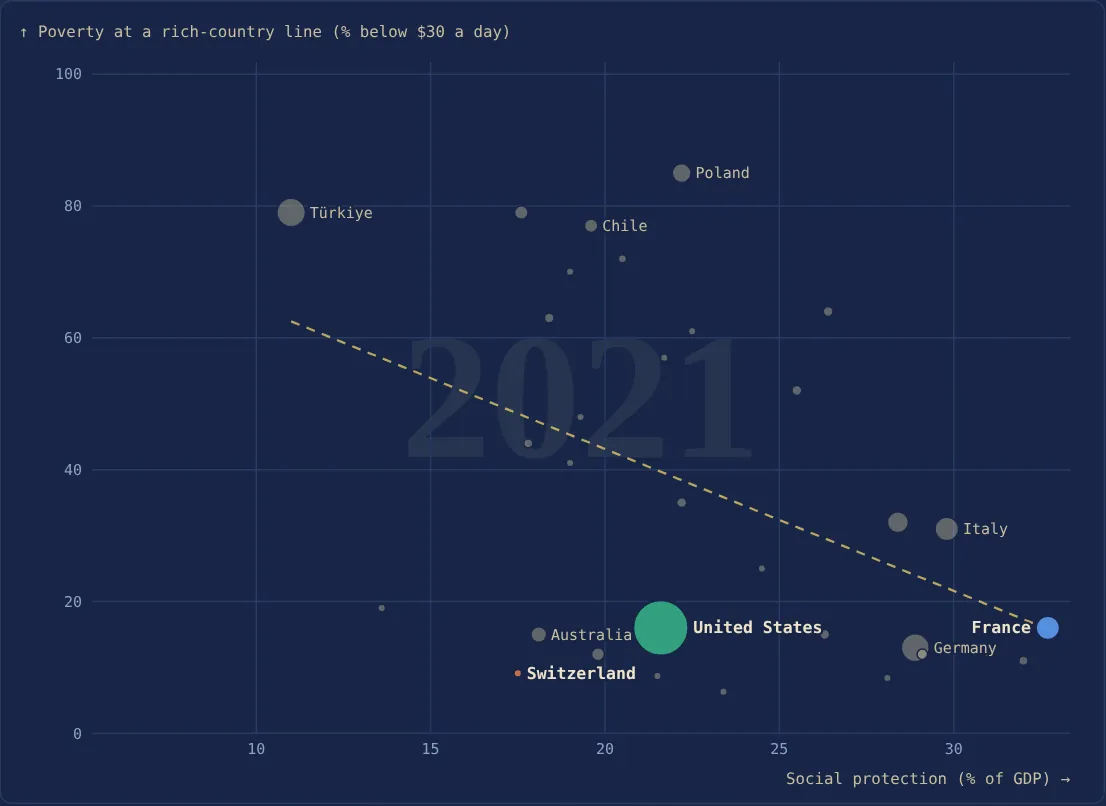
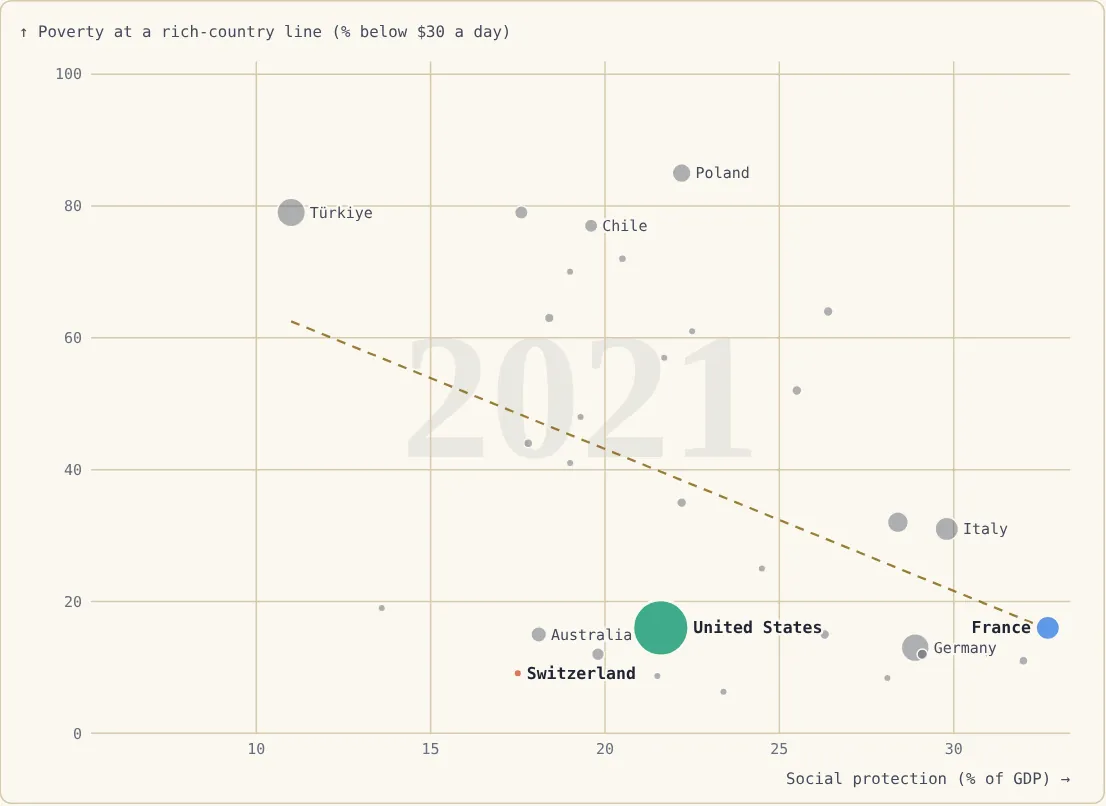
Among some forty rich countries, those spending more on social protection generally have fewer poor people, and the link holds at equal income (r ≈ −0.45).
Economic freedom as measured by the Fraser Institute also goes with less poverty (r ≈ −0.7), especially its “law and property rights” area (r ≈ −0.85): reliable courts, enforced contracts, little corruption. But its “small size of government” area goes the other way (r ≈ +0.5): countries with a small state tend to have more poor people. So it is not the minimal state that reduces poverty, but the rule of law, and redistribution.
Help the poorest, or everyone?
That leaves the question of how to spend. In 1998 the Swedish sociologists Walter Korpi and Joakim Palme described a “paradox of redistribution”: countries that reserve benefits for the poorest reduce poverty less than those paying benefits to everyone. Universal protection also benefits the middle classes, who then accept to fund a large budget, so the poorest receive more in total.
More recent work adds nuance. With 2000s data, Ive Marx, Lina Salanauskaite and Gerlinde Verbist (2013) no longer find this link: targeting often goes with more redistribution when total spending is high. David Brady and Amie Bostic (2015) also find that targeting does not prevent a generous budget. What stands out consistently is the amount: the more a country spends on social protection, the fewer poor people it has.
Limits
These are correlations between countries, not proof of cause: a rich country can at once afford good courts, strong social protection and have few poor people. Income surveys date from 2017 to 2019 depending on the country, and the $30 line is in 2017 dollars. Finally, income does not tell everything: free health care, schooling or social housing improve the lives of the poorest without showing up in their income.
Sources
- World Bank, Poverty and Inequality Platform ($30 and relative lines), via Our World in Data.
- OECD, social expenditure (SOCX); Gapminder (GDP per person); Fraser Institute, Economic Freedom of the World.
- W. Korpi and J. Palme, “The Paradox of Redistribution and Strategies of Equality”, American Sociological Review, 1998.
- I. Marx, L. Salanauskaite and G. Verbist, “The Paradox of Redistribution Revisited: And That It May Rest in Peace?”, IZA, 2013.
- D. Brady and A. Bostic, “Paradoxes of Social Policy”, American Sociological Review, 2015.
- D. Gugushvili and T. Laenen, “Two decades after Korpi and Palme's paradox of redistribution”, Journal of International and Comparative Social Policy, 2021.