Income inequality (Gini index)
0 if everyone has the same income, 100 if one person has everything. The higher the figure, the more unequal incomes are within the country.
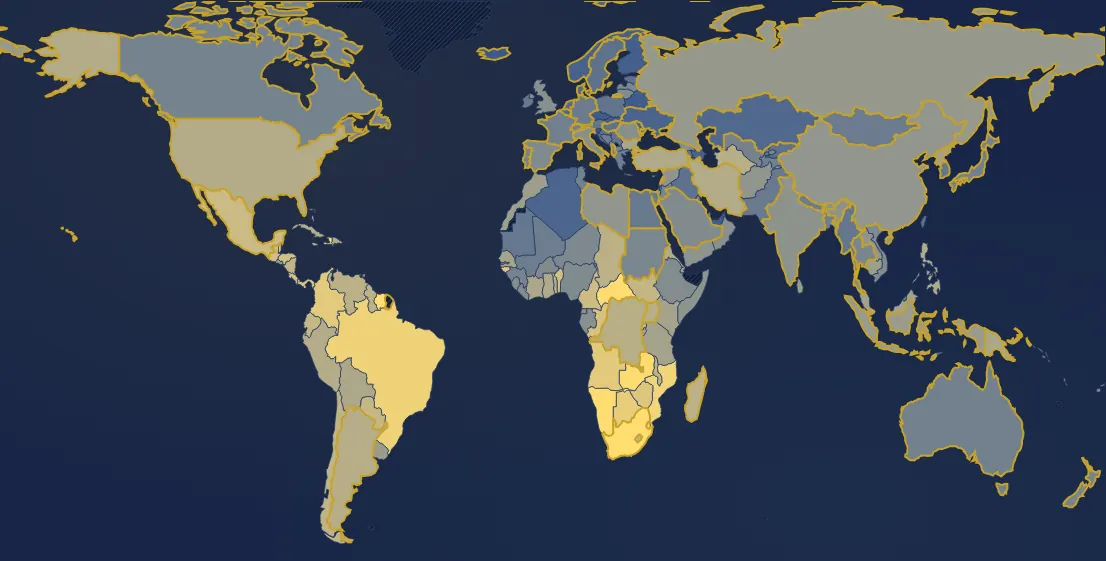
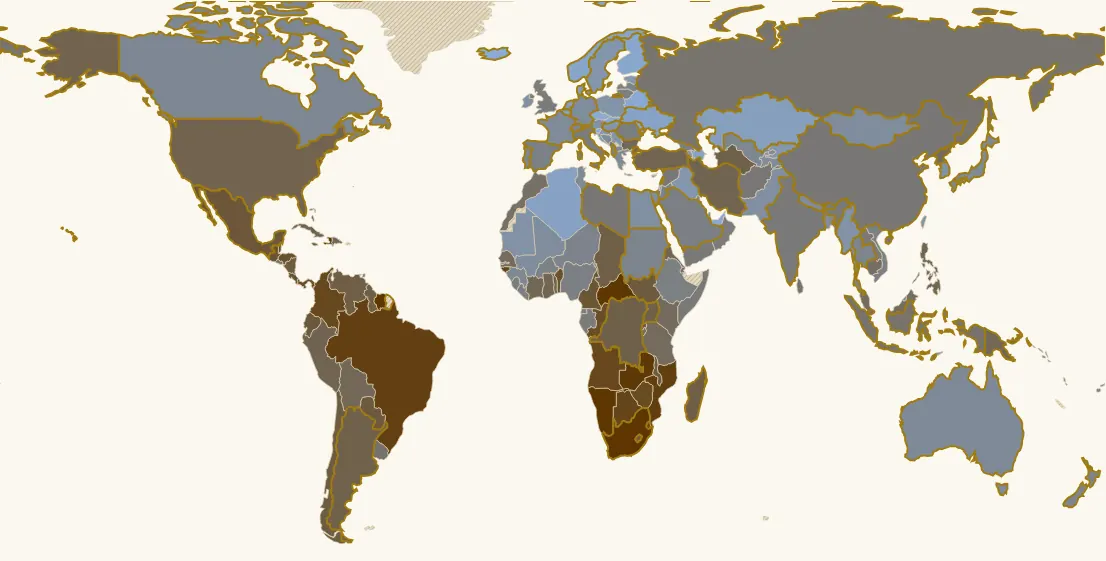
In 2021, 169 countries have a value. Highest: South Africa (64.9), Haiti (62.1), Suriname (61). Lowest: Slovenia (25.9), Iceland (26.1), Slovakia (26.4). World (population-weighted average): 39.6. France: 34.1 (125th of 169).
Country ranking in 2021
| Rank | Country | Value |
|---|---|---|
| 1 | South Africa | 64.9 |
| 2 | Haiti | 62.1 |
| 3 | Suriname | 61 |
| 4 | Namibia | 59.6 |
| 5 | Central African Republic | 59.4 |
| 6 | Zambia | 58.9 |
| 7 | Mozambique | 56.6 |
| 8 | Brazil | 56.1 |
| 9 | Eswatini | 56.1 |
| 10 | Botswana | 54 |
| 11 | Angola | 53 |
| 12 | Belize | 53 |
| 13 | Colombia | 53 |
| 14 | Guinea-Bissau | 52.8 |
| 15 | Zimbabwe | 51.8 |
| 16 | Panama | 51.2 |
| 17 | Congo - Brazzaville | 50.7 |
| 18 | Benin | 49.6 |
| 19 | Costa Rica | 49.5 |
| 20 | Honduras | 49.5 |
| 21 | Guatemala | 49.4 |
| 22 | Cameroon | 48.3 |
| 23 | Mexico | 48 |
| 24 | Ecuador | 47.2 |
| 25 | Paraguay | 47.1 |
| 26 | South Sudan | 46.8 |
| 27 | Malawi | 46.5 |
| 28 | Lesotho | 46.4 |
| 29 | Nicaragua | 46.3 |
| 30 | Chile | 46 |
| 31 | Jamaica | 46 |
| 32 | Madagascar | 45.4 |
| 33 | Guyana | 45.2 |
| 34 | Rwanda | 45.2 |
| 35 | Venezuela | 45.1 |
| 36 | Chad | 45 |
| 37 | Congo - Kinshasa | 44.7 |
| 38 | Turkmenistan | 44.7 |
| 39 | Argentina its history → | 44.6 |
| 40 | Uganda | 44.6 |
| 41 | Togo | 44.5 |
| 42 | Cuba | 44.1 |
| 43 | Bahamas | 44 |
| 44 | Eritrea | 44 |
| 45 | United States | 44 |
| 46 | Iran | 43.8 |
| 47 | Peru | 43.8 |
| 48 | Philippines | 43.7 |
| 49 | Ghana | 43.5 |
| 50 | Türkiye | 43.5 |
| 51 | Dominican Republic | 43.2 |
| 52 | Bolivia | 43 |
| 53 | Côte d’Ivoire | 43 |
| 54 | Papua New Guinea | 42.9 |
| 55 | Bulgaria | 42.7 |
| 56 | Kenya | 42 |
| 57 | North Korea | 42 |
| 58 | Tanzania | 42 |
| 59 | Senegal | 41.9 |
| 60 | Malaysia | 41.8 |
| 61 | Trinidad & Tobago | 41.8 |
| 62 | Burundi | 41.7 |
| 63 | Djibouti | 41.6 |
| 64 | Cambodia | 40.9 |
| 65 | Singapore | 40.9 |
| 66 | Morocco | 40.8 |
| 67 | Uruguay | 40.4 |
| 68 | Indonesia | 40.3 |
| 69 | Sri Lanka | 40.2 |
| 70 | El Salvador | 40.1 |
| 71 | Israel | 39.8 |
| 72 | Russia | 39.7 |
| 73 | China | 39.1 |
| 74 | Afghanistan | 39 |
| 75 | Libya | 39 |
| 76 | Laos | 38.8 |
| 77 | Syria | 38.8 |
| 78 | Somalia | 38.6 |
| 79 | Yemen | 38.5 |
| 80 | India its history → | 38.4 |
| 81 | Solomon Islands | 38 |
| 82 | Gabon | 37.9 |
| 83 | Oman | 37.9 |
| 84 | Montenegro | 37.8 |
| 85 | United Kingdom | 37.7 |
| 86 | Italy | 37.7 |
| 87 | Vanuatu | 37.6 |
| 88 | Bhutan | 37.3 |
| 89 | Georgia | 37.3 |
| 90 | Equatorial Guinea | 37.3 |
| 91 | Romania | 37.3 |
| 92 | Sierra Leone | 37.2 |
| 93 | Ethiopia | 37 |
| 94 | Lithuania | 37 |
| 95 | Liberia | 36.8 |
| 96 | Saudi Arabia | 36.8 |
| 97 | Nigeria | 36.7 |
| 98 | Burkina Faso | 36.6 |
| 99 | Vietnam | 36.6 |
| 100 | Spain its history → | 36.4 |
| 101 | Fiji | 36.3 |
| 102 | Kuwait | 36.1 |
| 103 | Niger | 36 |
| 104 | Latvia | 35.8 |
| 105 | Thailand | 35.7 |
| 106 | Sudan | 35.6 |
| 107 | Jordan | 35.4 |
| 108 | Luxembourg | 35.4 |
| 109 | New Zealand | 35.2 |
| 110 | Brunei | 35 |
| 111 | Guinea | 35 |
| 112 | Gambia | 35 |
| 113 | Uzbekistan | 35 |
| 114 | Canada | 34.9 |
| 115 | Portugal its history → | 34.9 |
| 116 | Palestine | 34.9 |
| 117 | Albania | 34.5 |
| 118 | Switzerland its history → | 34.5 |
| 119 | Australia its history → | 34.4 |
| 120 | Japan | 34.3 |
| 121 | North Macedonia | 34.3 |
| 122 | Tunisia | 34.3 |
| 123 | Greece | 34.2 |
| 124 | Qatar | 34.2 |
| 125 | France its history → | 34.1 |
| 126 | Tajikistan | 34.1 |
| 127 | Bosnia & Herzegovina | 33.9 |
| 128 | Bangladesh | 33.8 |
| 129 | Mali | 33.7 |
| 130 | Germany its history → | 33.5 |
| 131 | Mongolia | 33.5 |
| 132 | Nepal | 33.2 |
| 133 | Lebanon | 33.1 |
| 134 | Pakistan | 33.1 |
| 135 | Egypt | 32.9 |
| 136 | Cyprus | 32.7 |
| 137 | Ireland | 32.7 |
| 138 | Mauritania | 32.5 |
| 139 | Austria | 32.2 |
| 140 | South Korea | 32.1 |
| 141 | Myanmar (Burma) | 32.1 |
| 142 | Poland | 31.8 |
| 143 | Serbia | 31.7 |
| 144 | Taiwan | 31.5 |
| 145 | Sweden its history → | 31.3 |
| 146 | Armenia | 31.2 |
| 147 | Croatia | 31.1 |
| 148 | Hungary its history → | 31.1 |
| 149 | Estonia | 31 |
| 150 | Iraq | 31 |
| 151 | Kyrgyzstan | 31 |
| 152 | Timor-Leste | 30.3 |
| 153 | Denmark | 29.5 |
| 154 | Netherlands its history → | 29.5 |
| 155 | Kazakhstan | 29.2 |
| 156 | Malta | 28.7 |
| 157 | Belgium | 28.6 |
| 158 | Algeria | 28.6 |
| 159 | Azerbaijan | 28.3 |
| 160 | Ukraine its history → | 28.2 |
| 161 | Norway | 27.6 |
| 162 | Finland | 27.3 |
| 163 | Moldova | 27 |
| 164 | United Arab Emirates | 26.7 |
| 165 | Belarus | 26.6 |
| 166 | Czechia | 26.5 |
| 167 | Slovakia | 26.4 |
| 168 | Iceland | 26.1 |
| 169 | Slovenia | 25.9 |
9 countries or territories have no value that year.
Continent averages
| World (population-weighted average) | 39.6 |
| Europe (average) | 35.6 |
| Africa (average) | 41.6 |
| Americas (average) | 47.6 |
| Asia (average) | 38 |
| Oceania (average) | 36.6 |
Understanding this map
What this figure measures
The Gini coefficient sums up in one number how income is spread among residents. It comes mainly from household surveys (World Bank) and usually covers income after taxes and benefits or, in many poor countries, consumption, which gives slightly lower figures. Around 25-30, incomes are tightly bunched (Slovakia, Slovenia, Czechia, Iceland); above 55, very unequal.
Where inequality is highest
Southern Africa and Latin America lead: South Africa (about 65), Namibia, Suriname, Brazil (56). These gaps are partly the legacy of colonisation and, in South Africa, apartheid: land ownership and schooling long reserved for a minority. Europe is the most equal region, thanks in part to large social transfers. The United States (about 44) is well above European countries, and the gap has widened since 1980.
Limits
Surveys take place only every few years, and not everywhere: between surveys, and often before 1980, values are interpolated or reconstructed by Gapminder (the map starts in 1960; earlier reconstructions are too fragile) and should be read as orders of magnitude. Surveys poorly capture very high incomes, hence the “richest 10% share” view, drawn from tax data. The world average is the countries' average weighted by population: it measures average inequality within countries, not inequality among all the world's inhabitants.
Sources : Gapminder, coefficient de Gini v4 (CC BY 4.0), d’après la Banque mondiale
In the same theme : Inequality
All maps
Page updated on 2026-11-03.