Top marginal income tax rate
The tax rate on the highest income bracket: the share taken from each extra euro earned above the top threshold.
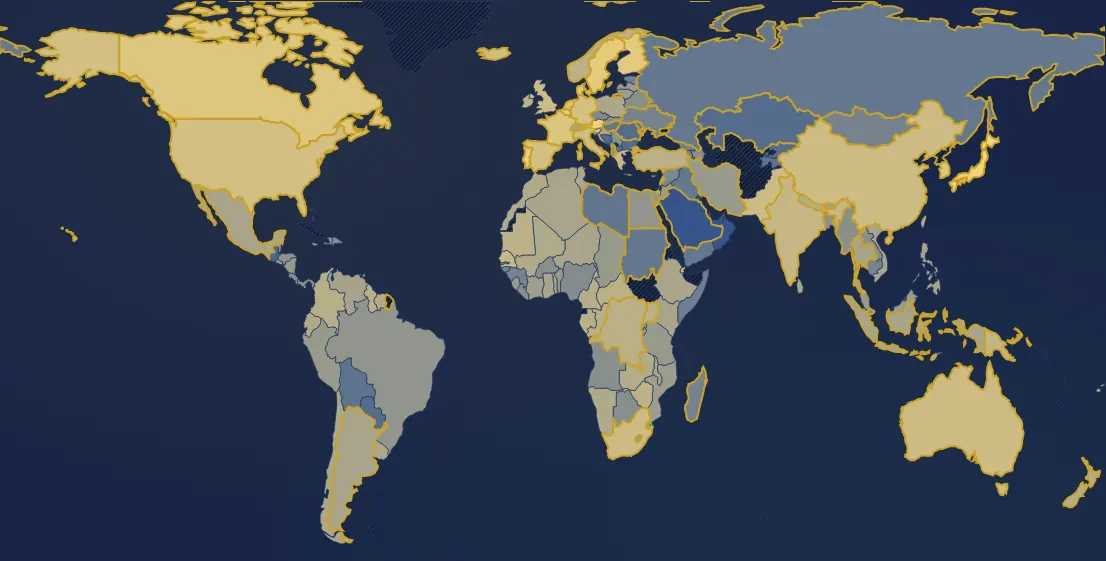
In 2024, 158 countries have a value. Highest: Japan (56 %), Austria (55 %), Portugal (53 %). Lowest: Saudi Arabia (0 %), Qatar (0 %), Oman (0 %). World (global median): 32 %. France: 49 % (13th of 158).
Country ranking in 2024
| Rank | Country | Value |
|---|---|---|
| 1 | Japan | 56 % |
| 2 | Austria | 55 % |
| 3 | Portugal its history → | 53 % |
| 4 | Belgium | 52.5 % |
| 5 | Denmark | 52 % |
| 6 | Sweden its history → | 52 % |
| 7 | Finland | 51 % |
| 8 | Israel | 50 % |
| 9 | South Korea | 50 % |
| 10 | Netherlands its history → | 50 % |
| 11 | Slovenia | 50 % |
| 12 | Canada | 49.5 % |
| 13 | France its history → | 49 % |
| 14 | Germany its history → | 47 % |
| 15 | Spain its history → | 47 % |
| 16 | United States | 46.5 % |
| 17 | Iceland | 46 % |
| 18 | Luxembourg | 46 % |
| 19 | Italy | 45.5 % |
| 20 | Australia its history → | 45 % |
| 21 | China | 45 % |
| 22 | Djibouti | 45 % |
| 23 | United Kingdom | 45 % |
| 24 | Pakistan | 45 % |
| 25 | South Africa | 45 % |
| 26 | Greece | 44 % |
| 27 | India its history → | 43 % |
| 28 | Senegal | 43 % |
| 29 | Papua New Guinea | 42 % |
| 30 | Zimbabwe | 41 % |
| 31 | Central African Republic | 40 % |
| 32 | Congo - Kinshasa | 40 % |
| 33 | Congo - Brazzaville | 40 % |
| 34 | Gabon | 40 % |
| 35 | Guyana | 40 % |
| 36 | Ireland | 40 % |
| 37 | Mauritania | 40 % |
| 38 | Norway | 40 % |
| 39 | Türkiye | 40 % |
| 40 | Taiwan | 40 % |
| 41 | Uganda | 40 % |
| 42 | Colombia | 39 % |
| 43 | Fiji | 39 % |
| 44 | Croatia | 39 % |
| 45 | Nepal | 39 % |
| 46 | New Zealand | 39 % |
| 47 | Cameroon | 38.5 % |
| 48 | Suriname | 38 % |
| 49 | Zambia | 38 % |
| 50 | Ecuador | 37 % |
| 51 | Morocco | 37 % |
| 52 | Mali | 37 % |
| 53 | Namibia | 37 % |
| 54 | Chile | 36 % |
| 55 | Sri Lanka | 36 % |
| 56 | Poland | 36 % |
| 57 | Tunisia | 36 % |
| 58 | Uruguay | 36 % |
| 59 | Argentina its history → | 35 % |
| 60 | Cyprus | 35 % |
| 61 | Algeria | 35 % |
| 62 | Ethiopia | 35 % |
| 63 | Ghana | 35 % |
| 64 | Indonesia | 35 % |
| 65 | Kenya | 35 % |
| 66 | Mexico | 35 % |
| 67 | Malta | 35 % |
| 68 | Malawi | 35 % |
| 69 | Niger | 35 % |
| 70 | Philippines | 35 % |
| 71 | Togo | 35 % |
| 72 | Thailand | 35 % |
| 73 | Vietnam | 35 % |
| 74 | Switzerland its history → | 34.5 % |
| 75 | Venezuela | 34 % |
| 76 | Bhutan | 33 % |
| 77 | Eswatini | 33 % |
| 78 | Côte d’Ivoire | 32 % |
| 79 | Lithuania | 32 % |
| 80 | Mozambique | 32 % |
| 81 | Jordan | 31 % |
| 82 | Latvia | 31 % |
| 83 | Burundi | 30 % |
| 84 | Benin | 30 % |
| 85 | Haiti | 30 % |
| 86 | Iran | 30 % |
| 87 | Jamaica | 30 % |
| 88 | Lesotho | 30 % |
| 89 | Malaysia | 30 % |
| 90 | Nicaragua | 30 % |
| 91 | Peru | 30 % |
| 92 | Rwanda | 30 % |
| 93 | Sierra Leone | 30 % |
| 94 | El Salvador | 30 % |
| 95 | Chad | 30 % |
| 96 | Trinidad & Tobago | 30 % |
| 97 | Tanzania | 30 % |
| 98 | Brazil | 28 % |
| 99 | Egypt | 28 % |
| 100 | Honduras | 27 % |
| 101 | Angola | 25 % |
| 102 | Azerbaijan | 25 % |
| 103 | Burkina Faso | 25 % |
| 104 | Bangladesh | 25 % |
| 105 | Belarus | 25 % |
| 106 | Belize | 25 % |
| 107 | Botswana | 25 % |
| 108 | Costa Rica | 25 % |
| 109 | Dominican Republic | 25 % |
| 110 | Gambia | 25 % |
| 111 | Laos | 25 % |
| 112 | Lebanon | 25 % |
| 113 | Liberia | 25 % |
| 114 | Myanmar (Burma) | 25 % |
| 115 | Panama | 25 % |
| 116 | Serbia | 25 % |
| 117 | Slovakia | 25 % |
| 118 | Nigeria | 24 % |
| 119 | Singapore | 24 % |
| 120 | Albania | 23 % |
| 121 | Czechia | 23 % |
| 122 | Syria | 22 % |
| 123 | Armenia | 20 % |
| 124 | Estonia | 20 % |
| 125 | Georgia | 20 % |
| 126 | Guinea | 20 % |
| 127 | Guinea-Bissau | 20 % |
| 128 | Cambodia | 20 % |
| 129 | Madagascar | 20 % |
| 130 | Mongolia | 20 % |
| 131 | Ukraine its history → | 20 % |
| 132 | Somalia | 18 % |
| 133 | Montenegro | 17 % |
| 134 | Hungary its history → | 15 % |
| 135 | Iraq | 15 % |
| 136 | Russia | 15 % |
| 137 | Sudan | 15 % |
| 138 | Yemen | 15 % |
| 139 | Libya | 14 % |
| 140 | Bolivia | 13 % |
| 141 | Moldova | 12 % |
| 142 | Tajikistan | 12 % |
| 143 | Bulgaria | 10 % |
| 144 | Bosnia & Herzegovina | 10 % |
| 145 | Kazakhstan | 10 % |
| 146 | Kyrgyzstan | 10 % |
| 147 | North Macedonia | 10 % |
| 148 | Paraguay | 10 % |
| 149 | Romania | 10 % |
| 150 | Timor-Leste | 10 % |
| 151 | Guatemala | 7 % |
| 152 | United Arab Emirates | 0 % |
| 153 | Bahamas | 0 % |
| 154 | Brunei | 0 % |
| 155 | Kuwait | 0 % |
| 156 | Oman | 0 % |
| 157 | Qatar | 0 % |
| 158 | Saudi Arabia | 0 % |
20 countries or territories have no value that year.
Continent averages
| World (global median) | 32 % |
| Europe (median of countries) | 35 % |
| Africa (median of countries) | 34 % |
| Americas (median of countries) | 30 % |
| Asia (median of countries) | 25 % |
Understanding this map
Marginal and average rates
The marginal rate only applies to the part of income above the top threshold: a French taxpayer at 45% does not pay 45% of their income, but 45% of each euro above about €180,000 (plus a 3-4% surcharge on very high incomes, included here). Yet it is the rate that matters for the decision to work, declare or shift one more euro, hence its role in debates on the Laffer curve.
Half a century of cuts
In the 1970s the top bracket often exceeded 60%: 70% in the United States, 83% in the United Kingdom, 87% in Sweden in 1980. The big cuts came next: the United Kingdom (40% by 1990), the United States (over thirty points lower in ten years), then Eastern Europe, where many countries adopted a flat tax after 2000 (Russia 13% in 2001, Slovakia 19% in 2004, Romania 16%, Bulgaria 10%). The median country went from 60% in 1980 to about 32% today. The Gulf states have no personal income tax.
And the Laffer curve?
According to the idea popularised by Arthur Laffer in the 1970s, beyond a certain rate raising taxes brings in less, because people work, declare or invest less. This map cannot show it: comparing countries does not say what would happen if one of them changed its rate, and tax on the highest incomes is only a small share of revenue. The Correlations tool follows countries that sharply cut their rate (example “A Laffer curve?”).
Limits
Data compiled by the Fraser Institute from the tax guides of PwC, EY, KPMG and the OECD. When the tax depends on the region (United States, Switzerland, Canada, Sweden…), Fraser gives a range; the map shows its midpoint and the tooltip the range. Before 2000, one value every five years, years in between interpolated. The threshold of the top bracket, which varies hugely (from a few thousand to several hundred thousand euros), is not taken into account. World and continents: median of countries.
In the same theme : Public finances
All maps
Page updated on 2026-11-03.