Share of public debt held abroad
What share of public debt is held by non-residents: foreign banks, funds, central banks and institutions. The rest belongs to the country's residents (banks, insurers, savers, the central bank).
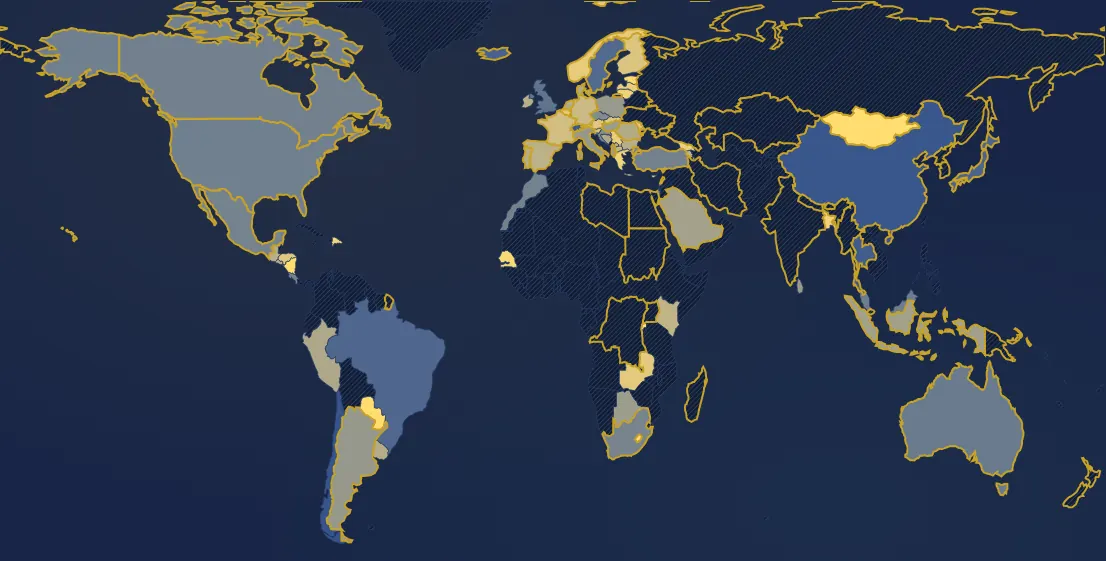
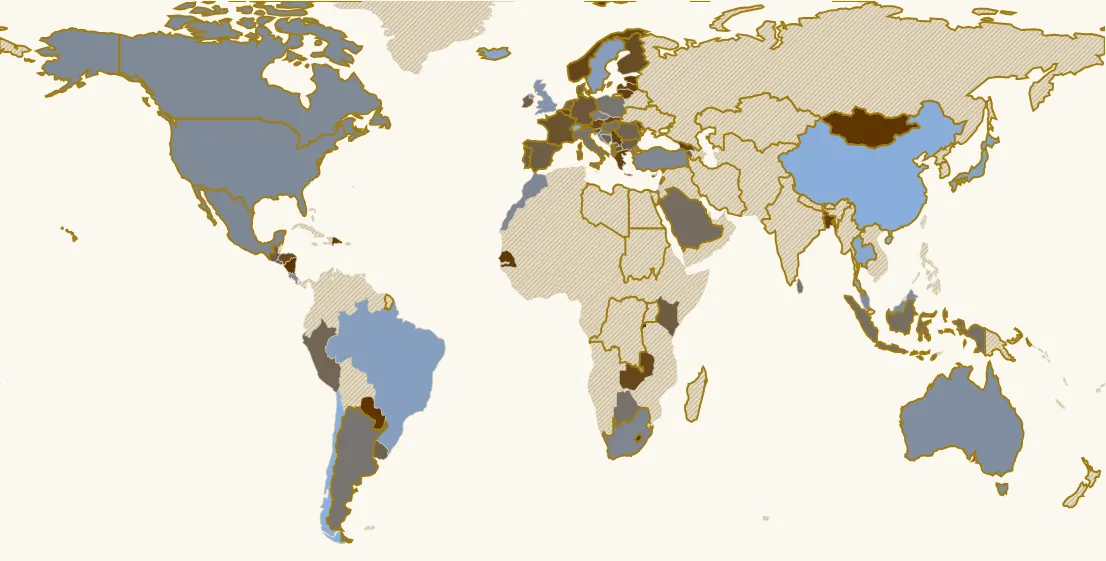
In 2025, 74 countries have a value. Highest: Mongolia (98 %), Paraguay (88 %), Cyprus (88 %). Lowest: Chile (2 %), China (6 %), Switzerland (6 %). France: 54 % (26th of 74).
Country ranking in 2025
| Rank | Country | Value |
|---|---|---|
| 1 | Mongolia | 98 % |
| 2 | Paraguay | 88 % |
| 3 | Cyprus | 88 % |
| 4 | Nicaragua | 85 % |
| 5 | Rwanda | 82 % |
| 6 | Lesotho | 80 % |
| 7 | Estonia | 78 % |
| 8 | Senegal | 76 % |
| 9 | Dominican Republic | 74 % |
| 10 | Bangladesh | 71 % |
| 11 | Greece | 71 % |
| 12 | Lithuania | 70 % |
| 13 | Serbia | 68 % |
| 14 | Georgia | 68 % |
| 15 | Latvia | 66 % |
| 16 | Norway | 65 % |
| 17 | Belgium | 63 % |
| 18 | Zambia | 63 % |
| 19 | Moldova | 61 % |
| 20 | Austria | 60 % |
| 21 | Luxembourg | 60 % |
| 22 | Slovakia | 60 % |
| 23 | Honduras | 60 % |
| 24 | Finland | 58 % |
| 25 | Slovenia | 57 % |
| 26 | France its history → | 54 % |
| 27 | Germany its history → | 51 % |
| 28 | North Macedonia | 50 % |
| 29 | Armenia | 47 % |
| 30 | Kosovo | 47 % |
| 31 | Kenya | 47 % |
| 32 | Spain its history → | 46 % |
| 33 | Guatemala | 45 % |
| 34 | Portugal its history → | 45 % |
| 35 | Bulgaria | 45 % |
| 36 | Ireland | 44 % |
| 37 | Netherlands its history → | 44 % |
| 38 | El Salvador | 44 % |
| 39 | Uruguay | 43 % |
| 40 | Romania | 43 % |
| 41 | Denmark | 42 % |
| 42 | Bosnia & Herzegovina | 42 % |
| 43 | Peru | 41 % |
| 44 | Saudi Arabia | 39 % |
| 45 | Indonesia | 38 % |
| 46 | Botswana | 36 % |
| 47 | Hungary its history → | 36 % |
| 48 | Sri Lanka | 35 % |
| 49 | Poland | 35 % |
| 50 | Albania | 35 % |
| 51 | Argentina its history → | 34 % |
| 52 | Italy | 34 % |
| 53 | Croatia | 29 % |
| 54 | Czechia | 29 % |
| 55 | South Africa | 26 % |
| 56 | Mexico | 25 % |
| 57 | Costa Rica | 25 % |
| 58 | Morocco | 24 % |
| 59 | Türkiye | 24 % |
| 60 | Canada | 24 % |
| 61 | United States | 23 % |
| 62 | Malta | 23 % |
| 63 | Malaysia | 22 % |
| 64 | Australia its history → | 21 % |
| 65 | United Kingdom | 18 % |
| 66 | Israel | 16 % |
| 67 | Sweden its history → | 14 % |
| 68 | Brazil | 13 % |
| 69 | Japan | 12 % |
| 70 | Iceland | 11 % |
| 71 | Thailand | 9 % |
| 72 | Switzerland its history → | 6 % |
| 73 | China | 6 % |
| 74 | Chile | 2 % |
104 countries or territories have no value that year.
Continent averages
| Europe (median of countries) | 47 % |
| Africa (median of countries) | 55 % |
| Americas (median of countries) | 41 % |
| Asia (median of countries) | 29 % |
Understanding this map
Why it matters
Debt held by the country's residents, banks or central bank is more stable: these lenders cannot easily leave, and interest stays in the country. That is how Japan can owe more than twice its GDP: only about 12% of its debt is held abroad. Conversely, foreign creditors can sell en masse at the first doubt and send interest rates soaring, especially if the debt is in dollars: the scenario of Argentina's crises.
A high share is not necessarily a danger
In the euro area, a German investor holding Austrian debt counts as “foreign”, even though everything is in euros: hence shares of 40 to 60% in Austria, Finland or Spain. In poor countries (Rwanda, Senegal, Mongolia…), foreign debt is often owed to the World Bank, the IMF or other states, at low rates and long maturities; the risk then comes mainly from currency, when the debt is in dollars and the local currency collapses.
Limits
About 80 countries publish this breakdown, most only since 2008-2010. Figures come from the World Bank; eleven European countries that do not report it there (France, Germany, Belgium, Greece, Norway, Poland…) are filled in from Eurostat, from 2016 at best. The two databases do not measure quite the same thing (gaps of a few points), so a given country always keeps the same source. Depending on the country, the figure covers general government, central government or the state budget only; the tooltip says so when it is not general government. Nor does the map say exactly who the holders are (central bank, banks, households) or what currency the debt is in. Continents: median of available countries, if at least five.
In the same theme : Public finances
All maps
Page updated on 2026-11-03.