CO₂ emissions per person — on the territory
Tonnes of CO₂ emitted each year on the country's territory, divided by its population.
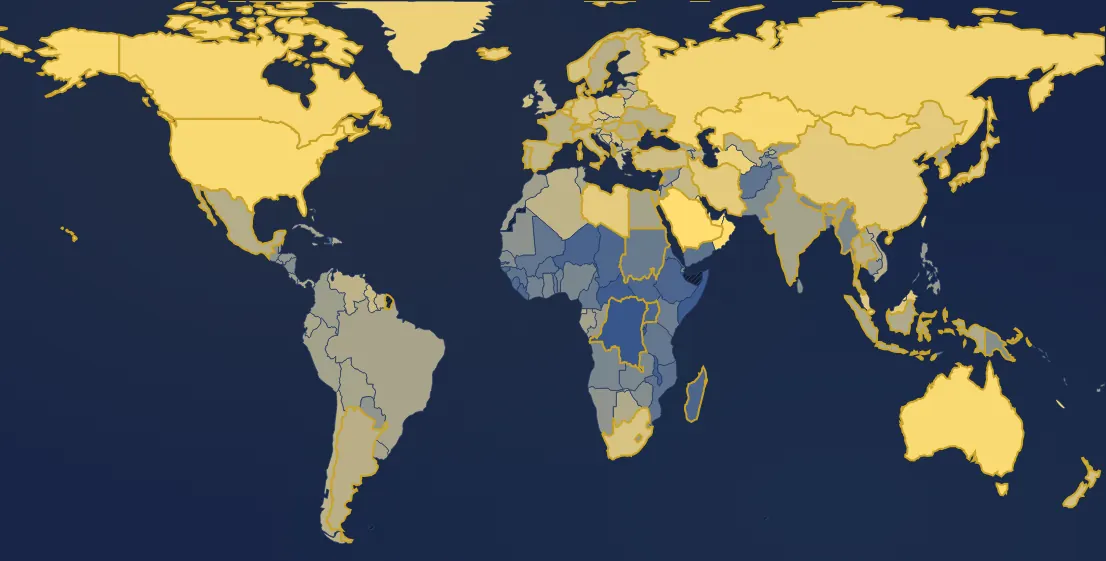
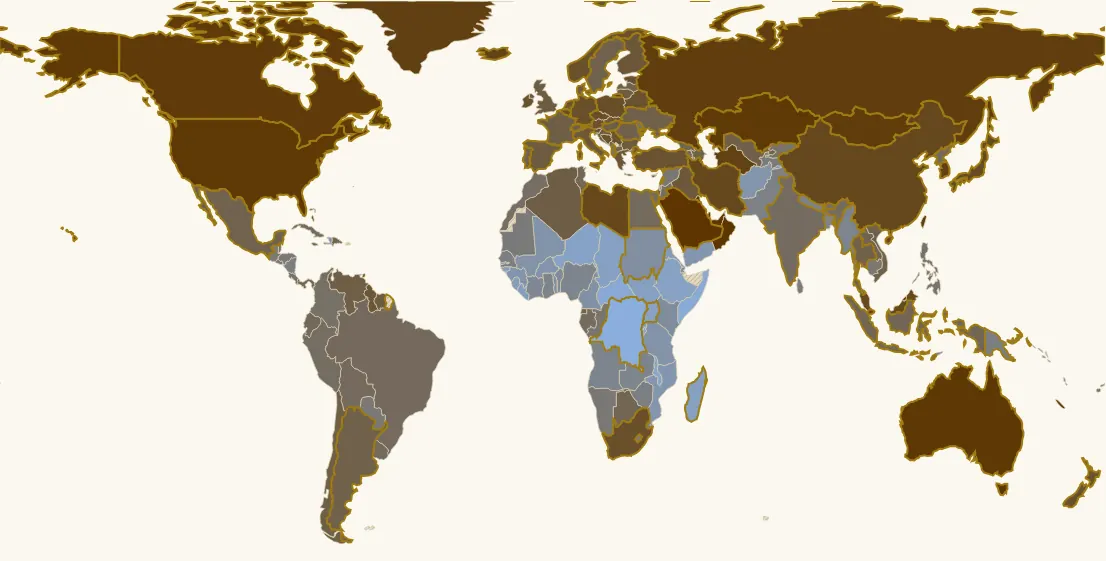
In 2024, 172 countries have a value. Highest: Qatar (41.3 t), Kuwait (26.2 t), Brunei (26 t). Lowest: Congo - Kinshasa (0.05 t), Burundi (0.07 t), Somalia (0.07 t). World (population-weighted average): 4.7 t. France: 4 t (64th of 172).
Country ranking in 2024
| Rank | Country | Value |
|---|---|---|
| 1 | Qatar | 41.3 t |
| 2 | Kuwait | 26.2 t |
| 3 | Brunei | 26 t |
| 4 | Trinidad & Tobago | 22.9 t |
| 5 | Saudi Arabia | 20.4 t |
| 6 | United Arab Emirates | 20.1 t |
| 7 | New Caledonia | 18.1 t |
| 8 | Oman | 15.7 t |
| 9 | Australia its history → | 14.5 t |
| 10 | United States | 14.2 t |
| 11 | Kazakhstan | 13.9 t |
| 12 | Canada | 13.4 t |
| 13 | Mongolia | 12.9 t |
| 14 | Russia | 12.3 t |
| 15 | South Korea | 11.3 t |
| 16 | Taiwan | 11.3 t |
| 17 | Greenland | 11.1 t |
| 18 | Turkmenistan | 10.8 t |
| 19 | Luxembourg | 10.5 t |
| 20 | Iceland | 9.7 t |
| 21 | Singapore | 9.2 t |
| 22 | Libya | 8.8 t |
| 23 | China | 8.7 t |
| 24 | Iran | 8.7 t |
| 25 | Bermuda | 8.5 t |
| 26 | Malaysia | 8.2 t |
| 27 | Japan | 7.8 t |
| 28 | Bahamas | 7.7 t |
| 29 | Belgium | 7.3 t |
| 30 | Poland | 7.1 t |
| 31 | Czechia | 7 t |
| 32 | South Africa | 6.9 t |
| 33 | Germany its history → | 6.8 t |
| 34 | Norway | 6.7 t |
| 35 | Ireland | 6.3 t |
| 36 | Netherlands its history → | 6.3 t |
| 37 | Serbia | 6.2 t |
| 38 | New Zealand | 6.2 t |
| 39 | Austria | 6.2 t |
| 40 | Belarus | 6.2 t |
| 41 | Bosnia & Herzegovina | 6.1 t |
| 42 | Estonia | 6.1 t |
| 43 | Slovenia | 6 t |
| 44 | Türkiye | 5.9 t |
| 45 | Israel | 5.6 t |
| 46 | Guyana | 5.4 t |
| 47 | Cyprus | 5.4 t |
| 48 | Greece | 5.3 t |
| 49 | Finland | 5.3 t |
| 50 | Slovakia | 5.3 t |
| 51 | Italy | 5.1 t |
| 52 | Iraq | 5.1 t |
| 53 | Croatia | 4.8 t |
| 54 | Denmark | 4.8 t |
| 55 | Suriname | 4.7 t |
| 56 | Bulgaria | 4.7 t |
| 57 | Spain its history → | 4.6 t |
| 58 | United Kingdom | 4.5 t |
| 59 | Lithuania | 4.4 t |
| 60 | Algeria | 4.2 t |
| 61 | Hungary its history → | 4.1 t |
| 62 | Venezuela | 4.1 t |
| 63 | Chile | 4 t |
| 64 | France its history → | 4 t |
| 65 | Azerbaijan | 3.9 t |
| 66 | Uzbekistan | 3.8 t |
| 67 | Ukraine its history → | 3.8 t |
| 68 | Argentina its history → | 3.7 t |
| 69 | Thailand | 3.7 t |
| 70 | Montenegro | 3.7 t |
| 71 | Equatorial Guinea | 3.7 t |
| 72 | Vietnam | 3.7 t |
| 73 | North Macedonia | 3.6 t |
| 74 | Switzerland its history → | 3.6 t |
| 75 | Romania | 3.6 t |
| 76 | Sweden its history → | 3.6 t |
| 77 | Mexico | 3.5 t |
| 78 | Latvia | 3.5 t |
| 79 | Portugal its history → | 3.4 t |
| 80 | Malta | 3.2 t |
| 81 | Laos | 3.1 t |
| 82 | Georgia | 3.1 t |
| 83 | Botswana | 3 t |
| 84 | Jamaica | 3 t |
| 85 | Dominican Republic | 2.9 t |
| 86 | Indonesia | 2.9 t |
| 87 | Panama | 2.8 t |
| 88 | Lebanon | 2.7 t |
| 89 | Tunisia | 2.7 t |
| 90 | Ecuador | 2.5 t |
| 91 | Armenia | 2.5 t |
| 92 | North Korea | 2.4 t |
| 93 | Uruguay | 2.4 t |
| 94 | Bolivia | 2.3 t |
| 95 | Brazil | 2.3 t |
| 96 | Cuba | 2.2 t |
| 97 | Egypt | 2.2 t |
| 98 | India its history → | 2.2 t |
| 99 | Gabon | 2.1 t |
| 100 | Bhutan | 2.1 t |
| 101 | Peru | 2.1 t |
| 102 | Jordan | 2 t |
| 103 | Belize | 1.9 t |
| 104 | Morocco | 1.8 t |
| 105 | Colombia | 1.8 t |
| 106 | Moldova | 1.8 t |
| 107 | Costa Rica | 1.7 t |
| 108 | Kyrgyzstan | 1.6 t |
| 109 | Albania | 1.6 t |
| 110 | Fiji | 1.6 t |
| 111 | Philippines | 1.5 t |
| 112 | El Salvador | 1.4 t |
| 113 | Congo - Brazzaville | 1.4 t |
| 114 | Syria | 1.3 t |
| 115 | Cambodia | 1.2 t |
| 116 | Honduras | 1.2 t |
| 117 | Namibia | 1.2 t |
| 118 | Paraguay | 1.2 t |
| 119 | Lesotho | 1.1 t |
| 120 | Guatemala | 1.1 t |
| 121 | Mauritania | 1 t |
| 122 | Tajikistan | 1 t |
| 123 | Sri Lanka | 0.9 t |
| 124 | Palestine | 0.87 t |
| 125 | Eswatini | 0.84 t |
| 126 | Zimbabwe | 0.82 t |
| 127 | Nicaragua | 0.81 t |
| 128 | Papua New Guinea | 0.79 t |
| 129 | Senegal | 0.76 t |
| 130 | Pakistan | 0.72 t |
| 131 | Nepal | 0.63 t |
| 132 | Bangladesh | 0.62 t |
| 133 | Ghana | 0.61 t |
| 134 | Vanuatu | 0.6 t |
| 135 | Angola | 0.59 t |
| 136 | Nigeria | 0.58 t |
| 137 | Myanmar (Burma) | 0.58 t |
| 138 | Zambia | 0.57 t |
| 139 | Djibouti | 0.48 t |
| 140 | Timor-Leste | 0.48 t |
| 141 | Côte d’Ivoire | 0.46 t |
| 142 | Benin | 0.42 t |
| 143 | Kenya | 0.38 t |
| 144 | Solomon Islands | 0.36 t |
| 145 | Sudan | 0.35 t |
| 146 | Cameroon | 0.33 t |
| 147 | Togo | 0.33 t |
| 148 | Tanzania | 0.29 t |
| 149 | Gambia | 0.29 t |
| 150 | Mali | 0.29 t |
| 151 | Burkina Faso | 0.28 t |
| 152 | Guinea | 0.27 t |
| 153 | Afghanistan | 0.25 t |
| 154 | Haiti | 0.25 t |
| 155 | Mozambique | 0.25 t |
| 156 | Yemen | 0.25 t |
| 157 | Eritrea | 0.21 t |
| 158 | Sierra Leone | 0.17 t |
| 159 | Guinea-Bissau | 0.16 t |
| 160 | Liberia | 0.15 t |
| 161 | Rwanda | 0.14 t |
| 162 | Madagascar | 0.14 t |
| 163 | South Sudan | 0.14 t |
| 164 | Chad | 0.14 t |
| 165 | Ethiopia | 0.14 t |
| 166 | Uganda | 0.13 t |
| 167 | Niger | 0.12 t |
| 168 | Malawi | 0.09 t |
| 169 | Central African Republic | 0.07 t |
| 170 | Somalia | 0.07 t |
| 171 | Burundi | 0.07 t |
| 172 | Congo - Kinshasa | 0.05 t |
6 countries or territories have no value that year.
Continent averages
| World (population-weighted average) | 4.7 t |
| Europe (average) | 6.4 t |
| Africa (average) | 0.99 t |
| Americas (average) | 6.9 t |
| Asia (average) | 4.8 t |
| Oceania (average) | 9.7 t |
Understanding this map
What is counted
CO₂ from coal, oil, gas and cement making; forest clearing is not counted. The “on the territory” measure counts what is emitted inside the country, including to make what it exports. It is the one used in climate agreements, and it goes back to 1800.
Territory or consumption?
The “from consumption” measure follows the products: it adds the CO₂ emitted abroad to make what the country imports, and removes that of its exports. A country that has its goods made elsewhere looks green on its territory without being so: Switzerland emits under 4 t per person at home, but about 14 t counting its consumption. Conversely, part of China's emissions goes into goods bought in Europe and the United States, but not all: even counting consumption, a Chinese resident now emits more than a French one. These estimates rely on world trade tables and only exist from 1990.
Two centuries of history
Britain, the cradle of the industrial revolution, leads the 19th century; the United States the 20th. Gulf oil states now have the highest per-person figures; China emits the most in total (about a third of world emissions), but less per person than the United States.
Per person or in total?
The map shows the per-person figure, which compares ways of life; the tooltip also gives the country's total and its share of that year's world emissions. For the climate, what counts is the total accumulated since 1750: the United States and Europe emitted the largest share.
Sources : Our World in Data / Global Carbon Project (CC BY 4.0)
All maps
Page updated on 2026-11-03.