Interest-growth gap (r − g)
The average interest rate paid on debt (r) minus nominal GDP growth (g, growth + inflation). Positive, debt grows by itself; negative, it melts by itself.
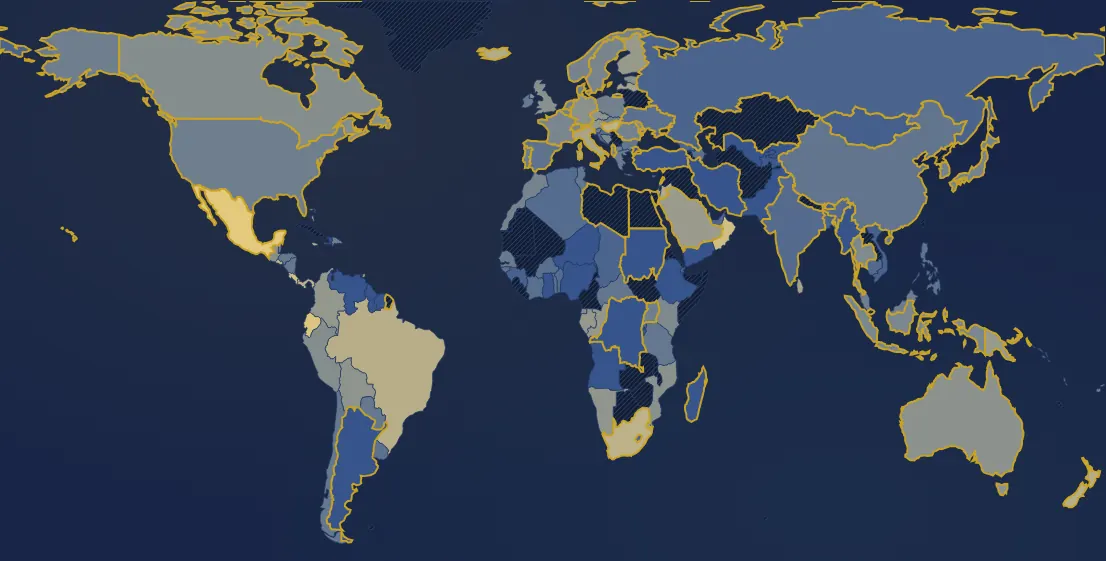
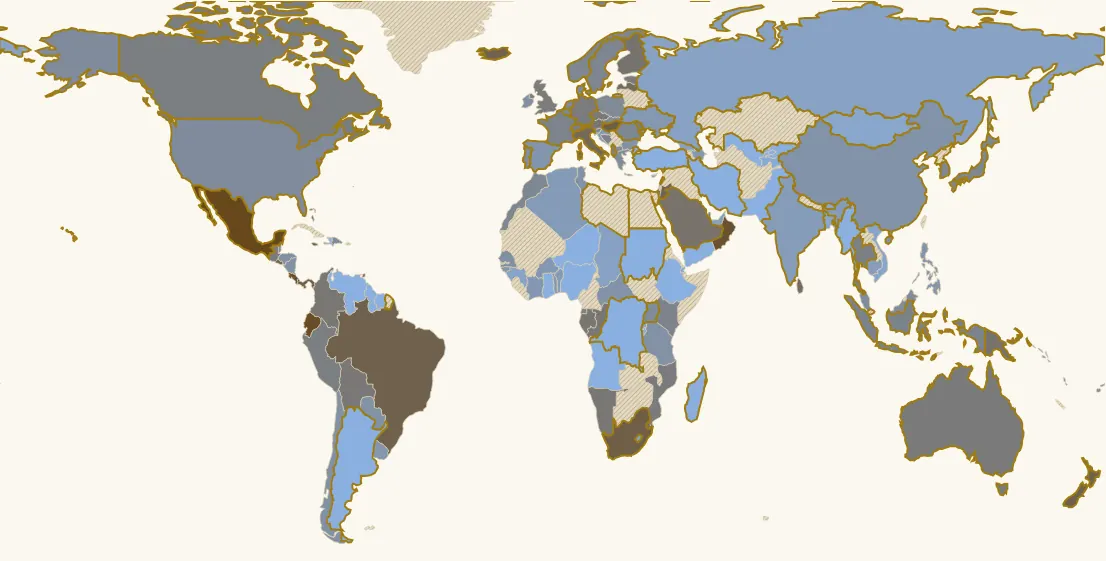
In 2024, 133 countries have a value. Highest: Mexico (+5.7 pts), Ecuador (+4.7 pts), Costa Rica (+4.1 pts). Lowest: Argentina (−67.9 pts), Sudan (−55.2 pts), Venezuela (−38.2 pts). World (global median): −2.8 pts. France: −1.8 pts (48th of 133).
Country ranking in 2024
| Rank | Country | Value |
|---|---|---|
| 1 | Mexico | +5.7 pts |
| 2 | Ecuador | +4.7 pts |
| 3 | Costa Rica | +4.1 pts |
| 4 | Oman | +3.8 pts |
| 5 | Trinidad & Tobago | +3.2 pts |
| 6 | Hungary its history → | +2.3 pts |
| 7 | South Africa | +2.2 pts |
| 8 | Panama | +2.2 pts |
| 9 | New Zealand | +1.8 pts |
| 10 | Brazil | +1.8 pts |
| 11 | El Salvador | +1.8 pts |
| 12 | Jamaica | +1.8 pts |
| 13 | Iceland | +1.6 pts |
| 14 | Jordan | +1.4 pts |
| 15 | Italy | +1 pts |
| 16 | Sri Lanka | +0.8 pts |
| 17 | Latvia | +0.8 pts |
| 18 | Israel | +0.7 pts |
| 19 | Eswatini | +0.6 pts |
| 20 | Bahamas | +0.4 pts |
| 21 | Saudi Arabia | +0.1 pts |
| 22 | Finland | 0 pts |
| 23 | Papua New Guinea | 0 pts |
| 24 | Gabon | −0.2 pts |
| 25 | Austria | −0.3 pts |
| 26 | Colombia | −0.3 pts |
| 27 | Congo - Brazzaville | −0.3 pts |
| 28 | Namibia | −0.4 pts |
| 29 | Bolivia | −0.5 pts |
| 30 | Czechia | −0.5 pts |
| 31 | Australia its history → | −0.7 pts |
| 32 | United Kingdom | −0.8 pts |
| 33 | Germany its history → | −0.8 pts |
| 34 | Guatemala | −0.8 pts |
| 35 | Mozambique | −0.8 pts |
| 36 | Estonia | −0.9 pts |
| 37 | Equatorial Guinea | −1 pts |
| 38 | Canada | −1.1 pts |
| 39 | Peru | −1.1 pts |
| 40 | Qatar | −1.1 pts |
| 41 | Moldova | −1.1 pts |
| 42 | Thailand | −1.4 pts |
| 43 | Luxembourg | −1.5 pts |
| 44 | Bosnia & Herzegovina | −1.5 pts |
| 45 | Kenya | −1.6 pts |
| 46 | Switzerland its history → | −1.7 pts |
| 47 | Indonesia | −1.7 pts |
| 48 | France its history → | −1.8 pts |
| 49 | Sweden its history → | −1.9 pts |
| 50 | Norway | −2 pts |
| 51 | Japan | −2.1 pts |
| 52 | Morocco | −2.1 pts |
| 53 | Slovenia | −2.1 pts |
| 54 | South Korea | −2.2 pts |
| 55 | Romania | −2.2 pts |
| 56 | Albania | −2.4 pts |
| 57 | Poland | −2.4 pts |
| 58 | Slovakia | −2.5 pts |
| 59 | United States | −2.6 pts |
| 60 | Netherlands its history → | −2.6 pts |
| 61 | Dominican Republic | −2.6 pts |
| 62 | Fiji | −2.6 pts |
| 63 | Portugal its history → | −2.7 pts |
| 64 | Uganda | −2.7 pts |
| 65 | Vanuatu | −2.7 pts |
| 66 | North Macedonia | −2.7 pts |
| 67 | Denmark | −2.8 pts |
| 68 | Malaysia | −2.8 pts |
| 69 | Greece | −2.9 pts |
| 70 | Belize | −2.9 pts |
| 71 | Belgium | −3.1 pts |
| 72 | Senegal | −3.2 pts |
| 73 | Ireland | −3.4 pts |
| 74 | Honduras | −3.4 pts |
| 75 | Chile | −3.5 pts |
| 76 | Nicaragua | −3.5 pts |
| 77 | Tanzania | −3.5 pts |
| 78 | Paraguay | −3.6 pts |
| 79 | Tunisia | −3.7 pts |
| 80 | Bulgaria | −3.7 pts |
| 81 | Central African Republic | −3.8 pts |
| 82 | China | −3.8 pts |
| 83 | Spain its history → | −4.1 pts |
| 84 | Philippines | −4.1 pts |
| 85 | Guinea-Bissau | −4.1 pts |
| 86 | Cyprus | −4.3 pts |
| 87 | Uruguay | −4.4 pts |
| 88 | Côte d’Ivoire | −4.6 pts |
| 89 | Togo | −4.6 pts |
| 90 | Burkina Faso | −4.6 pts |
| 91 | Azerbaijan | −4.6 pts |
| 92 | Ukraine its history → | −4.6 pts |
| 93 | Solomon Islands | −4.7 pts |
| 94 | Algeria | −5.1 pts |
| 95 | Benin | −5.1 pts |
| 96 | Croatia | −5.1 pts |
| 97 | India its history → | −5.2 pts |
| 98 | Cambodia | −5.5 pts |
| 99 | United Arab Emirates | −6.2 pts |
| 100 | Georgia | −6.3 pts |
| 101 | Chad | −6.5 pts |
| 102 | Lesotho | −6.5 pts |
| 103 | Russia | −6.7 pts |
| 104 | Guinea | −7.2 pts |
| 105 | Bangladesh | −7.4 pts |
| 106 | Vietnam | −7.4 pts |
| 107 | Rwanda | −7.6 pts |
| 108 | Mongolia | −7.7 pts |
| 109 | Djibouti | −7.8 pts |
| 110 | Bhutan | −8.1 pts |
| 111 | Tajikistan | −8.7 pts |
| 112 | Madagascar | −9.8 pts |
| 113 | Uzbekistan | −11.8 pts |
| 114 | Suriname | −12.4 pts |
| 115 | Niger | −12.4 pts |
| 116 | Kyrgyzstan | −12.8 pts |
| 117 | Pakistan | −13.2 pts |
| 118 | Haiti | −16.4 pts |
| 119 | Burundi | −17.4 pts |
| 120 | Yemen | −17.6 pts |
| 121 | Congo - Kinshasa | −18.5 pts |
| 122 | Myanmar (Burma) | −18.8 pts |
| 123 | Ghana | −19.1 pts |
| 124 | Angola | −20.6 pts |
| 125 | Nigeria | −23 pts |
| 126 | Iran | −23.5 pts |
| 127 | Ethiopia | −25.8 pts |
| 128 | Lebanon | −27.1 pts |
| 129 | Guyana | −31.7 pts |
| 130 | Türkiye | −32.7 pts |
| 131 | Venezuela | −38.2 pts |
| 132 | Sudan | −55.2 pts |
| 133 | Argentina its history → | −67.9 pts |
45 countries or territories have no value that year.
Continent averages
| World (global median) | −2.8 pts |
| Europe (median of countries) | −2.3 pts |
| Africa (median of countries) | −4.6 pts |
| Americas (median of countries) | −1.1 pts |
| Asia (median of countries) | −5.3 pts |
| Oceania (median of countries) | −1.6 pts |
Understanding this map
The mechanics of debt
Relative to GDP, debt moves under two forces. The primary balance (see “Deficit / surplus”): a deficit excluding interest raises it. And the gap between the interest rate paid (r) and nominal GDP growth (g): if interest swells debt faster than GDP grows (r > g), the debt / GDP ratio rises by itself, the “snowball” effect; if r < g, it falls by itself. As a formula: change in debt ≈ (r − g) / (1 + g) × last year's debt − primary balance. The second view gives the first term, in points of GDP.
Forty years of the gap
From 1985 to 1999, in a Europe of high rates and controlled inflation, r exceeded g: by 2 points on average in France and Germany, nearly 3 in Italy, whose debt climbed despite primary surpluses. In the 2010s, with very low rates, the gap became zero or negative, which revived the debate on debt sustainability (economist Olivier Blanchard summed it up in 2019: when r < g, debt costs less than was thought). In 2021-2022, the rebound and inflation sent g soaring: the gap became strongly negative in rich countries, and debts fell as a % of GDP. In 2024 France is at −1.8 points; as inflation recedes and debt is renewed at higher rates, the gap is closing.
When inflation wipes out debt
Very negative gaps (Turkey, Argentina, about −30 to −70 points) come from inflation: it inflates GDP in local currency much faster than debt. But it is not free: those who lent to the state are repaid in devalued money, and dollar debt does not melt. World and continents: median of countries (an average would be swept away by these extreme cases).
Limits
r is the apparent average rate (the year's interest / the previous year's debt, IMF), not the rate at which the country borrows today. g combines real growth and consumer-price inflation from the World Economic Outlook, in place of the GDP deflator: an approximation, clearly too high in 2022, when imported energy pushed consumer prices up far more than the prices of what the country produces (for Italy, g is nearly 14% here, while its nominal GDP grew considerably less). The series starts in 1980 and ends in 2024 (forecasts not used); it only covers countries for which the IMF publishes interest.
Sources : FMI, Public Finances in Modern History (Mauro et al.) ; World Economic Outlook
In the same theme : Public finances
All maps
Page updated on 2026-11-03.