Share of people aged 65 and over
The share of residents aged 65 or over: population ageing.
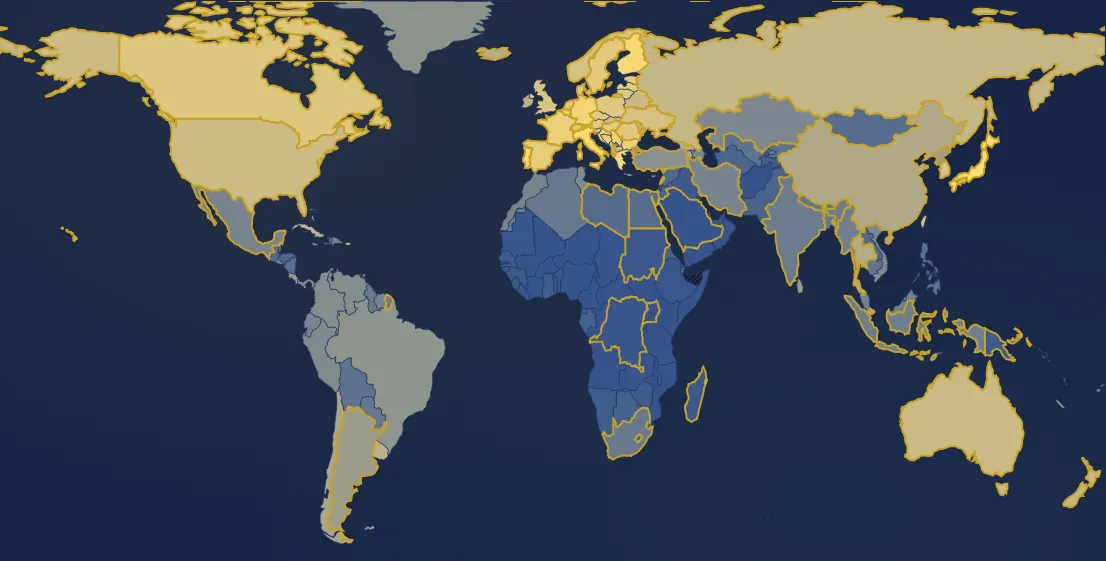
In 2024, 177 countries have a value. Highest: Japan (29.8 %), Puerto Rico (24.7 %), Italy (24.6 %). Lowest: Qatar (1.7 %), United Arab Emirates (1.8 %), Zambia (1.9 %). World (population-weighted average): 10.2 %. France: 22.1 % (11th of 177).
Country ranking in 2024
| Rank | Country | Value |
|---|---|---|
| 1 | Japan | 29.8 % |
| 2 | Puerto Rico | 24.7 % |
| 3 | Italy | 24.6 % |
| 4 | Portugal its history → | 24.5 % |
| 5 | Finland | 23.9 % |
| 6 | Greece | 23.9 % |
| 7 | Germany its history → | 23.2 % |
| 8 | Croatia | 23.2 % |
| 9 | Serbia | 22.7 % |
| 10 | Bosnia & Herzegovina | 22.2 % |
| 11 | France its history → | 22.1 % |
| 12 | Bulgaria | 22 % |
| 13 | Slovenia | 21.8 % |
| 14 | Bermuda | 21.7 % |
| 15 | Latvia | 21.7 % |
| 16 | Estonia | 21.3 % |
| 17 | Spain its history → | 21.1 % |
| 18 | Hungary its history → | 21 % |
| 19 | Denmark | 20.9 % |
| 20 | Czechia | 20.8 % |
| 21 | Sweden its history → | 20.7 % |
| 22 | Austria | 20.6 % |
| 23 | Belgium | 20.6 % |
| 24 | Netherlands its history → | 20.5 % |
| 25 | Lithuania | 20.2 % |
| 26 | Malta | 20.2 % |
| 27 | Poland | 20.1 % |
| 28 | Switzerland its history → | 20 % |
| 29 | Romania | 20 % |
| 30 | Canada | 19.8 % |
| 31 | United Kingdom | 19.5 % |
| 32 | South Korea | 19.3 % |
| 33 | Taiwan | 19.2 % |
| 34 | Ukraine its history → | 19 % |
| 35 | Norway | 18.8 % |
| 36 | Slovakia | 18.5 % |
| 37 | North Macedonia | 18 % |
| 38 | United States | 17.9 % |
| 39 | Montenegro | 17.8 % |
| 40 | Australia its history → | 17.7 % |
| 41 | Belarus | 17.7 % |
| 42 | New Zealand | 17.2 % |
| 43 | Russia | 17.2 % |
| 44 | Albania | 16.9 % |
| 45 | Cuba | 16.6 % |
| 46 | Moldova | 16.2 % |
| 47 | Uruguay | 16 % |
| 48 | Ireland | 15.9 % |
| 49 | Georgia | 15.6 % |
| 50 | Iceland | 15.6 % |
| 51 | Luxembourg | 15.5 % |
| 52 | Thailand | 15.4 % |
| 53 | China | 14.7 % |
| 54 | Cyprus | 14.6 % |
| 55 | Chile | 14.1 % |
| 56 | Armenia | 13.7 % |
| 57 | Singapore | 13.7 % |
| 58 | Israel | 12.6 % |
| 59 | Argentina its history → | 12.4 % |
| 60 | Falkland Islands (Islas Malvinas) | 12.4 % |
| 61 | North Korea | 12.4 % |
| 62 | Trinidad & Tobago | 12.4 % |
| 63 | Costa Rica | 12.2 % |
| 64 | Sri Lanka | 12.1 % |
| 65 | Bahamas | 11.8 % |
| 66 | New Caledonia | 11.4 % |
| 67 | Brazil | 11 % |
| 68 | Greenland | 10.8 % |
| 69 | Türkiye | 10.3 % |
| 70 | Kosovo | 10.1 % |
| 71 | Lebanon | 10.1 % |
| 72 | Colombia | 9.8 % |
| 73 | Venezuela | 9.7 % |
| 74 | Tunisia | 9.5 % |
| 75 | Panama | 9.4 % |
| 76 | Peru | 9.2 % |
| 77 | Vietnam | 9 % |
| 78 | Kazakhstan | 8.7 % |
| 79 | Azerbaijan | 8.6 % |
| 80 | Ecuador | 8.3 % |
| 81 | Iran | 8.2 % |
| 82 | Jamaica | 8.2 % |
| 83 | Mexico | 8.2 % |
| 84 | Morocco | 8.1 % |
| 85 | El Salvador | 8.1 % |
| 86 | Dominican Republic | 7.9 % |
| 87 | Suriname | 7.9 % |
| 88 | Malaysia | 7.7 % |
| 89 | Indonesia | 7.3 % |
| 90 | Myanmar (Burma) | 7.3 % |
| 91 | India its history → | 7.1 % |
| 92 | French Guiana | 7 % |
| 93 | Brunei | 6.9 % |
| 94 | Guyana | 6.7 % |
| 95 | South Africa | 6.7 % |
| 96 | Algeria | 6.6 % |
| 97 | Western Sahara | 6.6 % |
| 98 | Bangladesh | 6.5 % |
| 99 | Bhutan | 6.5 % |
| 100 | Fiji | 6.5 % |
| 101 | Nepal | 6.5 % |
| 102 | Paraguay | 6.5 % |
| 103 | Cambodia | 6.2 % |
| 104 | Uzbekistan | 5.9 % |
| 105 | Kyrgyzstan | 5.7 % |
| 106 | Bolivia | 5.6 % |
| 107 | Nicaragua | 5.5 % |
| 108 | Philippines | 5.5 % |
| 109 | Timor-Leste | 5.3 % |
| 110 | Egypt | 5.1 % |
| 111 | Mongolia | 5.1 % |
| 112 | Belize | 5 % |
| 113 | Libya | 5 % |
| 114 | Djibouti | 4.9 % |
| 115 | Guatemala | 4.8 % |
| 116 | Haiti | 4.7 % |
| 117 | Laos | 4.7 % |
| 118 | Syria | 4.7 % |
| 119 | Jordan | 4.5 % |
| 120 | Turkmenistan | 4.5 % |
| 121 | Honduras | 4.4 % |
| 122 | Pakistan | 4.3 % |
| 123 | Eswatini | 4.3 % |
| 124 | Vanuatu | 4.3 % |
| 125 | Eritrea | 4.2 % |
| 126 | Gabon | 4.1 % |
| 127 | Botswana | 4 % |
| 128 | Lesotho | 3.9 % |
| 129 | Rwanda | 3.9 % |
| 130 | Tajikistan | 3.9 % |
| 131 | Palestine | 3.8 % |
| 132 | Ghana | 3.7 % |
| 133 | Equatorial Guinea | 3.7 % |
| 134 | Namibia | 3.7 % |
| 135 | Senegal | 3.6 % |
| 136 | Solomon Islands | 3.6 % |
| 137 | Zimbabwe | 3.6 % |
| 138 | Guinea | 3.5 % |
| 139 | Papua New Guinea | 3.5 % |
| 140 | Iraq | 3.4 % |
| 141 | Madagascar | 3.4 % |
| 142 | Liberia | 3.3 % |
| 143 | Sudan | 3.3 % |
| 144 | Ethiopia | 3.2 % |
| 145 | Guinea-Bissau | 3.2 % |
| 146 | Mauritania | 3.2 % |
| 147 | Sierra Leone | 3.2 % |
| 148 | Togo | 3.2 % |
| 149 | Benin | 3.1 % |
| 150 | Congo - Kinshasa | 3.1 % |
| 151 | Gambia | 3.1 % |
| 152 | Kuwait | 3.1 % |
| 153 | Congo - Brazzaville | 3 % |
| 154 | Kenya | 3 % |
| 155 | Nigeria | 3 % |
| 156 | Saudi Arabia | 3 % |
| 157 | South Sudan | 3 % |
| 158 | Tanzania | 3 % |
| 159 | Angola | 2.9 % |
| 160 | Cameroon | 2.8 % |
| 161 | Mozambique | 2.8 % |
| 162 | Burkina Faso | 2.7 % |
| 163 | Côte d’Ivoire | 2.6 % |
| 164 | Malawi | 2.6 % |
| 165 | Niger | 2.6 % |
| 166 | Oman | 2.6 % |
| 167 | Somalia | 2.6 % |
| 168 | Burundi | 2.5 % |
| 169 | Yemen | 2.5 % |
| 170 | Afghanistan | 2.4 % |
| 171 | Mali | 2.4 % |
| 172 | Central African Republic | 2.2 % |
| 173 | Uganda | 2.2 % |
| 174 | Chad | 2.1 % |
| 175 | Zambia | 1.9 % |
| 176 | United Arab Emirates | 1.8 % |
| 177 | Qatar | 1.7 % |
1 countries or territories have no value that year.
Continent averages
| World (population-weighted average) | 10.2 % |
| Europe (average) | 19.3 % |
| Africa (average) | 3.6 % |
| Americas (average) | 12.8 % |
| Asia (average) | 10 % |
| Oceania (average) | 13.7 % |
Understanding this map
The great ageing
Worldwide, the share of people aged 65 and over has doubled, from about 5% in 1950 to 10% today. Two causes: people live longer, and above all they have fewer children, so younger generations are smaller. Japan is the oldest country (nearly 30%), ahead of Italy, Portugal, Greece and Finland (about 24%); France is at 22%, against 11% in 1950. South Korea is ageing fastest: 3% in 1950, 7% in 2000, 19% today.
Young countries
In sub-Saharan Africa, where fertility remains high, people aged 65 and over make up only 2 to 3% of the population (Niger, Chad). Gulf states also show very low figures (under 2% in Qatar and the UAE), but for another reason: a large share of their residents are working-age immigrant workers.
Why it matters
Ageing weighs on pensions and health care, funded by fewer workers per retiree, and on public debt. Compare it, in the “Correlations” tool, with social protection spending. Figures come from UN estimates (World Population Prospects), reliable for countries with regular censuses.
Sources : ONU, World Population Prospects, via Gapminder (CC BY 4.0)
In the same theme : Population
All maps
Page updated on 2026-11-03.