Immigrants as a share of the population
The share of residents born in a country other than the one where they live (international migrants, as defined by the UN).
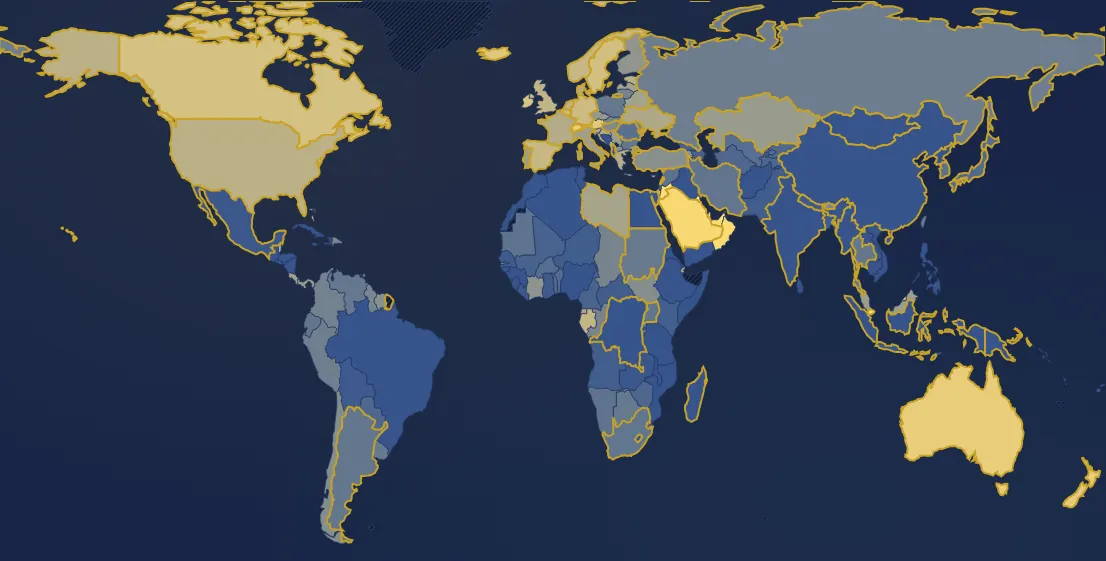
In 2024, 169 countries have a value. Highest: Qatar (76.7 %), United Arab Emirates (74 %), Kuwait (67.3 %). Lowest: Cuba (0.02 %), Philippines (0.08 %), Madagascar (0.12 %). World (population-weighted average): 3.7 %. France: 13.8 % (37th of 169).
Country ranking in 2024
| Rank | Country | Value |
|---|---|---|
| 1 | Qatar | 76.7 % |
| 2 | United Arab Emirates | 74 % |
| 3 | Kuwait | 67.3 % |
| 4 | Luxembourg | 51.2 % |
| 5 | Singapore | 48.7 % |
| 6 | Jordan | 45.7 % |
| 7 | Oman | 43.2 % |
| 8 | Saudi Arabia | 40.3 % |
| 9 | Malta | 37 % |
| 10 | Switzerland its history → | 31.1 % |
| 11 | Australia its history → | 30.4 % |
| 12 | New Zealand | 28.2 % |
| 13 | Brunei | 25.9 % |
| 14 | Austria | 25.5 % |
| 15 | Iceland | 25.1 % |
| 16 | Lebanon | 24.5 % |
| 17 | Ireland | 23.1 % |
| 18 | Israel | 22.3 % |
| 19 | Canada | 22.2 % |
| 20 | Sweden its history → | 21.4 % |
| 21 | Belgium | 20 % |
| 22 | Germany its history → | 19.8 % |
| 23 | Spain its history → | 18.5 % |
| 24 | Norway | 18.1 % |
| 25 | Gabon | 17.7 % |
| 26 | United Kingdom | 17.1 % |
| 27 | Bahamas | 16.8 % |
| 28 | Belize | 16.5 % |
| 29 | Netherlands its history → | 16.2 % |
| 30 | United States | 15.2 % |
| 31 | Cyprus | 14.9 % |
| 32 | Estonia | 14.9 % |
| 33 | Slovenia | 14.9 % |
| 34 | Montenegro | 14.4 % |
| 35 | Denmark | 14.2 % |
| 36 | Greece | 14.2 % |
| 37 | France its history → | 13.8 % |
| 38 | Croatia | 13.6 % |
| 39 | Ukraine its history → | 13.4 % |
| 40 | Equatorial Guinea | 13.2 % |
| 41 | Costa Rica | 12.2 % |
| 42 | Libya | 12.2 % |
| 43 | Latvia | 11.8 % |
| 44 | Belarus | 11.6 % |
| 45 | Italy | 11 % |
| 46 | Djibouti | 10.8 % |
| 47 | Portugal its history → | 10.8 % |
| 48 | Malaysia | 10.7 % |
| 49 | Panama | 10.6 % |
| 50 | Serbia | 10.6 % |
| 51 | Kazakhstan | 10.2 % |
| 52 | Czechia | 9.6 % |
| 53 | Armenia | 9.2 % |
| 54 | Finland | 9.2 % |
| 55 | Côte d’Ivoire | 9 % |
| 56 | Gambia | 8.6 % |
| 57 | North Macedonia | 8.3 % |
| 58 | Suriname | 8.2 % |
| 59 | Türkiye | 8.1 % |
| 60 | Chile | 7.8 % |
| 61 | South Sudan | 7.7 % |
| 62 | Trinidad & Tobago | 7.5 % |
| 63 | Hungary its history → | 7.1 % |
| 64 | Bhutan | 7 % |
| 65 | Dominican Republic | 6.5 % |
| 66 | Guyana | 6.5 % |
| 67 | Moldova | 6.2 % |
| 68 | Chad | 6.2 % |
| 69 | Congo - Brazzaville | 6.1 % |
| 70 | Lithuania | 6.1 % |
| 71 | Slovakia | 5.9 % |
| 72 | Colombia | 5.8 % |
| 73 | Peru | 5.4 % |
| 74 | Russia | 5.2 % |
| 75 | Palestine | 5 % |
| 76 | Taiwan | 4.9 % |
| 77 | Sudan | 4.8 % |
| 78 | Uruguay | 4.7 % |
| 79 | Botswana | 4.6 % |
| 80 | Poland | 4.5 % |
| 81 | Venezuela | 4.5 % |
| 82 | Bulgaria | 4.4 % |
| 83 | Thailand | 4.4 % |
| 84 | Argentina its history → | 4.3 % |
| 85 | Iran | 4.2 % |
| 86 | Ecuador | 4.1 % |
| 87 | Uganda | 4.1 % |
| 88 | South Africa | 4.1 % |
| 89 | Mauritania | 3.8 % |
| 90 | Namibia | 3.8 % |
| 91 | Rwanda | 3.6 % |
| 92 | Syria | 3.6 % |
| 93 | South Korea | 3.5 % |
| 94 | Romania | 3.5 % |
| 95 | Uzbekistan | 3.2 % |
| 96 | Burkina Faso | 3.1 % |
| 97 | Togo | 3 % |
| 98 | Benin | 2.9 % |
| 99 | Burundi | 2.8 % |
| 100 | Japan | 2.8 % |
| 101 | Kyrgyzstan | 2.7 % |
| 102 | Eswatini | 2.7 % |
| 103 | Paraguay | 2.6 % |
| 104 | Tajikistan | 2.6 % |
| 105 | Turkmenistan | 2.6 % |
| 106 | Zimbabwe | 2.6 % |
| 107 | Cameroon | 2.2 % |
| 108 | Mali | 2.2 % |
| 109 | Azerbaijan | 2.1 % |
| 110 | Georgia | 2.1 % |
| 111 | Angola | 1.8 % |
| 112 | Central African Republic | 1.8 % |
| 113 | Kenya | 1.8 % |
| 114 | Albania | 1.7 % |
| 115 | Bangladesh | 1.7 % |
| 116 | Niger | 1.7 % |
| 117 | Pakistan | 1.7 % |
| 118 | Fiji | 1.6 % |
| 119 | Ghana | 1.6 % |
| 120 | Nepal | 1.6 % |
| 121 | Bolivia | 1.5 % |
| 122 | Senegal | 1.5 % |
| 123 | Liberia | 1.3 % |
| 124 | Mexico | 1.3 % |
| 125 | Zambia | 1.2 % |
| 126 | Bosnia & Herzegovina | 1.1 % |
| 127 | Mozambique | 1 % |
| 128 | Vanuatu | 1 % |
| 129 | Congo - Kinshasa | 0.99 % |
| 130 | Egypt | 0.98 % |
| 131 | Yemen | 0.97 % |
| 132 | Ethiopia | 0.88 % |
| 133 | Malawi | 0.86 % |
| 134 | Jamaica | 0.85 % |
| 135 | Iraq | 0.81 % |
| 136 | Guinea | 0.8 % |
| 137 | Guinea-Bissau | 0.68 % |
| 138 | El Salvador | 0.68 % |
| 139 | Tanzania | 0.67 % |
| 140 | Brazil | 0.66 % |
| 141 | Laos | 0.66 % |
| 142 | Mongolia | 0.65 % |
| 143 | Lesotho | 0.64 % |
| 144 | Nicaragua | 0.63 % |
| 145 | Nigeria | 0.6 % |
| 146 | Timor-Leste | 0.59 % |
| 147 | Sierra Leone | 0.58 % |
| 148 | Algeria | 0.55 % |
| 149 | Tunisia | 0.51 % |
| 150 | Guatemala | 0.5 % |
| 151 | Cambodia | 0.48 % |
| 152 | Somalia | 0.41 % |
| 153 | Honduras | 0.37 % |
| 154 | Eritrea | 0.35 % |
| 155 | India its history → | 0.33 % |
| 156 | Vietnam | 0.32 % |
| 157 | Solomon Islands | 0.3 % |
| 158 | Morocco | 0.29 % |
| 159 | Papua New Guinea | 0.29 % |
| 160 | Afghanistan | 0.23 % |
| 161 | North Korea | 0.19 % |
| 162 | Sri Lanka | 0.18 % |
| 163 | Haiti | 0.17 % |
| 164 | Indonesia | 0.16 % |
| 165 | Myanmar (Burma) | 0.15 % |
| 166 | China | 0.12 % |
| 167 | Madagascar | 0.12 % |
| 168 | Philippines | 0.08 % |
| 169 | Cuba | 0.02 % |
9 countries or territories have no value that year.
Continent averages
| World (population-weighted average) | 3.7 % |
| Europe (average) | 12 % |
| Africa (average) | 1.9 % |
| Americas (average) | 7.5 % |
| Asia (average) | 1.7 % |
| Oceania (average) | 21.6 % |
Understanding this map
What this figure measures
The UN counts as an international migrant anyone living in a country other than their country of birth, refugees included, whatever their nationality. For France this gives about 14%: more than Insee's 11%, which counts as immigrants only people born foreign abroad, not French-born citizens born outside France. A few countries, lacking place-of-birth data, count foreign nationals instead.
The gaps
The records are in the Gulf, where foreign workers outnumber nationals: about 77% in Qatar, 74% in the UAE, 67% in Kuwait. Then small, very open countries (Luxembourg, about half; Singapore) and Switzerland (31%). Germany (20%), the United Kingdom (17%), the United States (15%) and France (14%) sit in a similar range. At the other end, Japan (under 3%) and above all China and India, where immigrants are under 1%. Worldwide, about 3.7% of people live outside their country of birth, against 2.8% in 1990.
Limits
UN estimates are made every five years (1990, 1995… 2020, then 2024); years in between are interpolated (the tooltip says so). Borders matter: after 1991, residents of the former USSR born in another republic became “migrants” without moving, hence high shares in Kazakhstan or Estonia. Irregular migrants are poorly counted.
Sources : ONU DESA, International Migrant Stock, via Gapminder (CC BY 4.0)
In the same theme : Population
All maps
Page updated on 2026-11-03.