Share of taxes eaten up by interest on debt
The interest government pays on its debt, compared with everything it collects (taxes and social contributions). At 10%, one euro of tax in ten goes to paying interest.
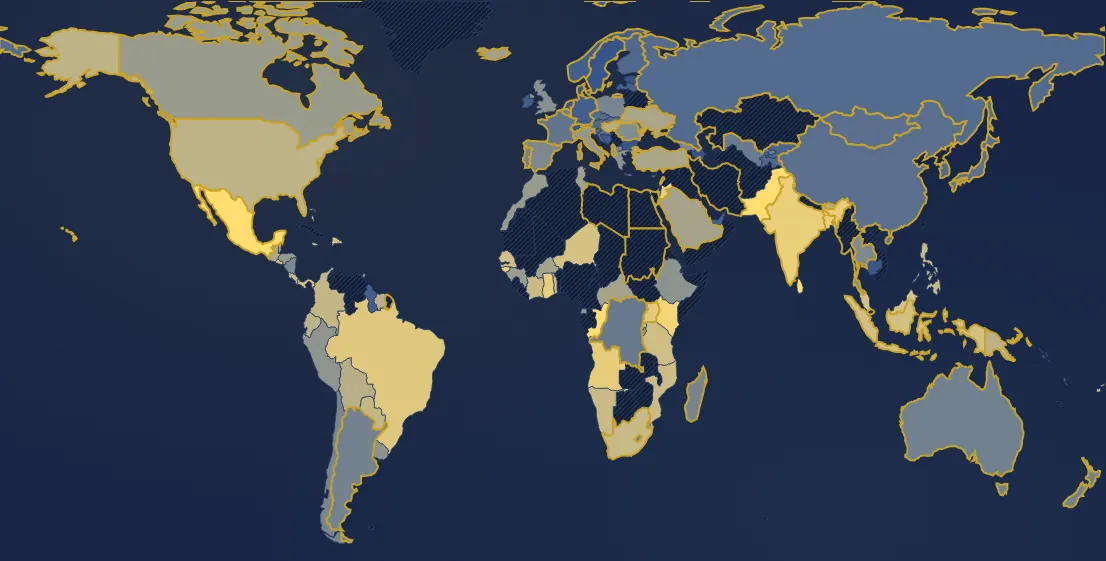
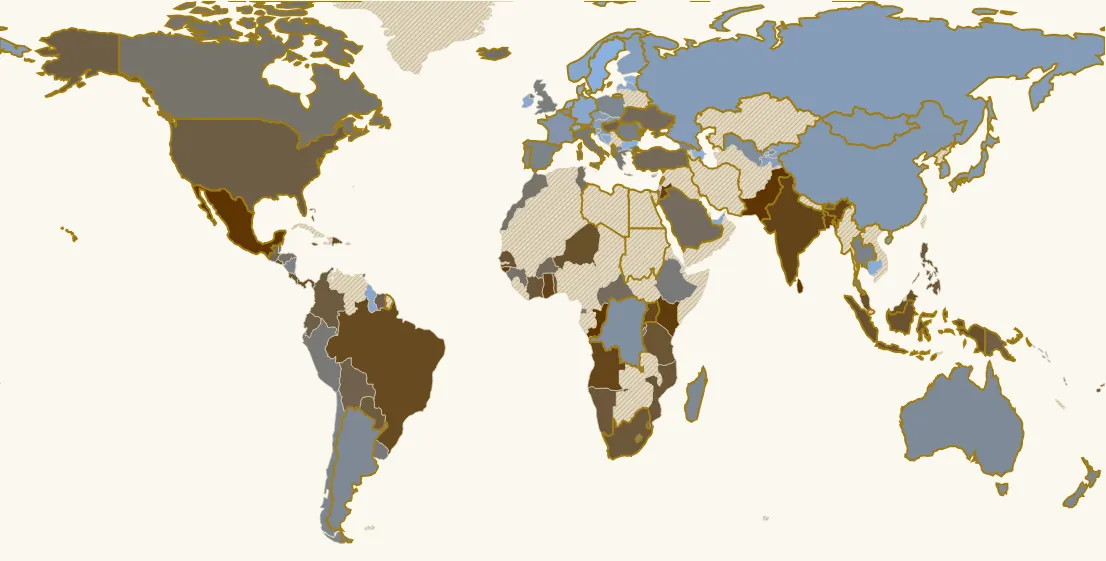
In 2024, 117 countries have a value. Highest: Sri Lanka (79.7 %), Pakistan (62.6 %), Congo - Brazzaville (60 %). Lowest: Luxembourg (0.8 %), Switzerland (1.3 %), Sweden (1.6 %). World (GDP-weighted average): 10.7 %. France: 4.7 % (85th of 117).
Country ranking in 2024
| Rank | Country | Value |
|---|---|---|
| 1 | Sri Lanka | 79.7 % |
| 2 | Pakistan | 62.6 % |
| 3 | Congo - Brazzaville | 60 % |
| 4 | Mexico | 45.3 % |
| 5 | Guinea-Bissau | 36.2 % |
| 6 | Kenya | 35.2 % |
| 7 | Jordan | 31.9 % |
| 8 | Bangladesh | 31.4 % |
| 9 | Ghana | 29.7 % |
| 10 | India its history → | 29.5 % |
| 11 | Angola | 28.7 % |
| 12 | Uganda | 26.3 % |
| 13 | Brazil | 25.3 % |
| 14 | Dominican Republic | 23.6 % |
| 15 | Panama | 23.3 % |
| 16 | Bahamas | 22.8 % |
| 17 | Malaysia | 22.5 % |
| 18 | Niger | 22.3 % |
| 19 | El Salvador | 22.2 % |
| 20 | Indonesia | 21.5 % |
| 21 | Senegal | 21.3 % |
| 22 | Tanzania | 20.4 % |
| 23 | Togo | 19.9 % |
| 24 | Mozambique | 19.8 % |
| 25 | Côte d’Ivoire | 19.6 % |
| 26 | Costa Rica | 19.4 % |
| 27 | Fiji | 19.3 % |
| 28 | Trinidad & Tobago | 19.2 % |
| 29 | Namibia | 19.1 % |
| 30 | South Africa | 18.7 % |
| 31 | Jamaica | 18.5 % |
| 32 | Philippines | 18.3 % |
| 33 | Paraguay | 17.5 % |
| 34 | Colombia | 17.4 % |
| 35 | Rwanda | 17.1 % |
| 36 | Bhutan | 15.9 % |
| 37 | United States | 15.9 % |
| 38 | Papua New Guinea | 15.4 % |
| 39 | Ecuador | 15.3 % |
| 40 | Suriname | 14.8 % |
| 41 | Bolivia | 14.5 % |
| 42 | Hungary its history → | 14.5 % |
| 43 | Guatemala | 13.1 % |
| 44 | Türkiye | 12.8 % |
| 45 | Ukraine its history → | 12.7 % |
| 46 | Burkina Faso | 12 % |
| 47 | Saudi Arabia | 12 % |
| 48 | Central African Republic | 11.9 % |
| 49 | Belize | 11.6 % |
| 50 | Tunisia | 11.6 % |
| 51 | Israel | 11.5 % |
| 52 | Iceland | 11.4 % |
| 53 | Eswatini | 10.6 % |
| 54 | Honduras | 10.5 % |
| 55 | Guinea | 10.3 % |
| 56 | Canada | 10.1 % |
| 57 | Morocco | 10.1 % |
| 58 | Burundi | 9.9 % |
| 59 | Equatorial Guinea | 9.7 % |
| 60 | Italy | 9.3 % |
| 61 | Peru | 8.9 % |
| 62 | Ethiopia | 8.7 % |
| 63 | Greece | 8.7 % |
| 64 | Uruguay | 8.7 % |
| 65 | Albania | 8.5 % |
| 66 | United Kingdom | 8.1 % |
| 67 | Romania | 7.5 % |
| 68 | Thailand | 7.1 % |
| 69 | Nicaragua | 7 % |
| 70 | Spain its history → | 6.7 % |
| 71 | Georgia | 6.5 % |
| 72 | Chile | 6.4 % |
| 73 | Lesotho | 6.4 % |
| 74 | North Macedonia | 6.4 % |
| 75 | Poland | 6.3 % |
| 76 | Madagascar | 6.1 % |
| 77 | New Zealand | 5.9 % |
| 78 | Argentina its history → | 5.8 % |
| 79 | Portugal its history → | 5.8 % |
| 80 | Australia its history → | 5.7 % |
| 81 | Belgium | 5.3 % |
| 82 | Uzbekistan | 5.3 % |
| 83 | Congo - Kinshasa | 5.2 % |
| 84 | Vanuatu | 4.8 % |
| 85 | France its history → | 4.7 % |
| 86 | Cyprus | 4.5 % |
| 87 | Moldova | 4.5 % |
| 88 | China | 4.3 % |
| 89 | Japan | 4.3 % |
| 90 | Mongolia | 4.3 % |
| 91 | Croatia | 4.1 % |
| 92 | Czechia | 4 % |
| 93 | Slovakia | 4 % |
| 94 | Russia | 3.9 % |
| 95 | South Korea | 3.8 % |
| 96 | Finland | 3.7 % |
| 97 | Austria | 3.6 % |
| 98 | Tajikistan | 3.6 % |
| 99 | Slovenia | 3.5 % |
| 100 | Kyrgyzstan | 3.4 % |
| 101 | Latvia | 2.9 % |
| 102 | United Arab Emirates | 2.8 % |
| 103 | Germany its history → | 2.8 % |
| 104 | Guyana | 2.8 % |
| 105 | Norway | 2.8 % |
| 106 | Bosnia & Herzegovina | 2.7 % |
| 107 | Ireland | 2.7 % |
| 108 | Cambodia | 2.3 % |
| 109 | Solomon Islands | 2.1 % |
| 110 | Denmark | 1.8 % |
| 111 | Netherlands its history → | 1.8 % |
| 112 | Bulgaria | 1.7 % |
| 113 | Estonia | 1.7 % |
| 114 | Azerbaijan | 1.6 % |
| 115 | Sweden its history → | 1.6 % |
| 116 | Switzerland its history → | 1.3 % |
| 117 | Luxembourg | 0.8 % |
61 countries or territories have no value that year.
Continent averages
| World (GDP-weighted average) | 10.7 % |
| Europe (average) | 5.6 % |
| Americas (average) | 17.5 % |
| Asia (average) | 10.7 % |
| Oceania (average) | 5.9 % |
Understanding this map
Why compare interest with taxes
The “interest” view compares the cost of debt with the country's wealth (GDP). But the state does not pay with all of GDP: it pays with what it collects. For the same burden, a country that collects little feels it far more. In 2024 Pakistan pays about 8% of its GDP in interest and Italy 4%; but Pakistan collects only 12% of its GDP, Italy 42%: interest takes over 60% of Pakistan's taxes, less than a tenth of Italy's. The IMF and rating agencies watch this ratio closely: above 15 to 20%, interest starts to crowd out other spending.
France: only 5%?
The map compares the interest paid by all levels of government with all compulsory levies, social contributions included (about 45% of GDP): about 5% in 2024, against 3% in 2020 and 8% in the mid-1990s. But the debt is mostly the state's (about 80%), while a large share of levies goes to social security. Measured against the state's own tax revenue, the burden is much heavier: about €65 billion in 2025 for some €356 billion of net tax revenue, nearly one euro in five (according to the French Senate finance committee). And it has been rising fast since 2022, as debt borrowed at near-zero rates is renewed at 3%.
Where interest weighs most
The records are in poor countries that collect little and borrow at high rates: Sri Lanka (about 80% in 2024, after its 2022 default), Pakistan (over 60%), Kenya, Ghana, Bangladesh, India (about 30%). In rich countries the ratio peaked in the 1980s-1990s, when rates were very high: Italy spent up to nearly a third of its taxes on interest (1992-1995). It then melted as rates fell, before rising again since 2022, sharply in the United States (about 16% in 2024).
Limits
Levies count taxes and social contributions, not other revenue: oil or mining rents, dividends from state companies, foreign grants. The ratio is therefore overstated where such revenue matters (Mexico and Congo draw much of their resources from oil); countries collecting less than 6% of GDP (mostly oil states) are excluded. Interest and debt (IMF) and levies (UNU-WIDER) come from two sources whose scope can differ slightly (general or central government). Series from 1980; when a year's levies are not yet published, the map carries the last known value (up to three years, the tooltip says so). World and continents: total interest (or debt) divided by total levies of available countries, shown when they make up at least 60% of the zone's GDP.
In the same theme : Public finances
All maps
Page updated on 2026-11-03.