Share of electricity from low-carbon (renewables + nuclear) sources
Share of this source in the electricity the country generated that year. Data from 1985, for about 210 countries.
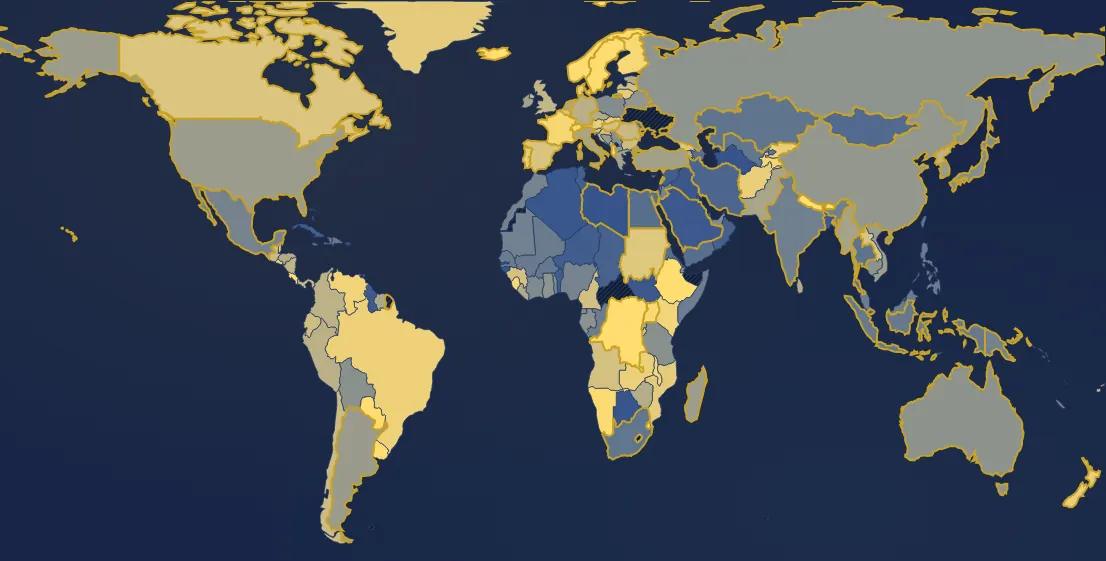
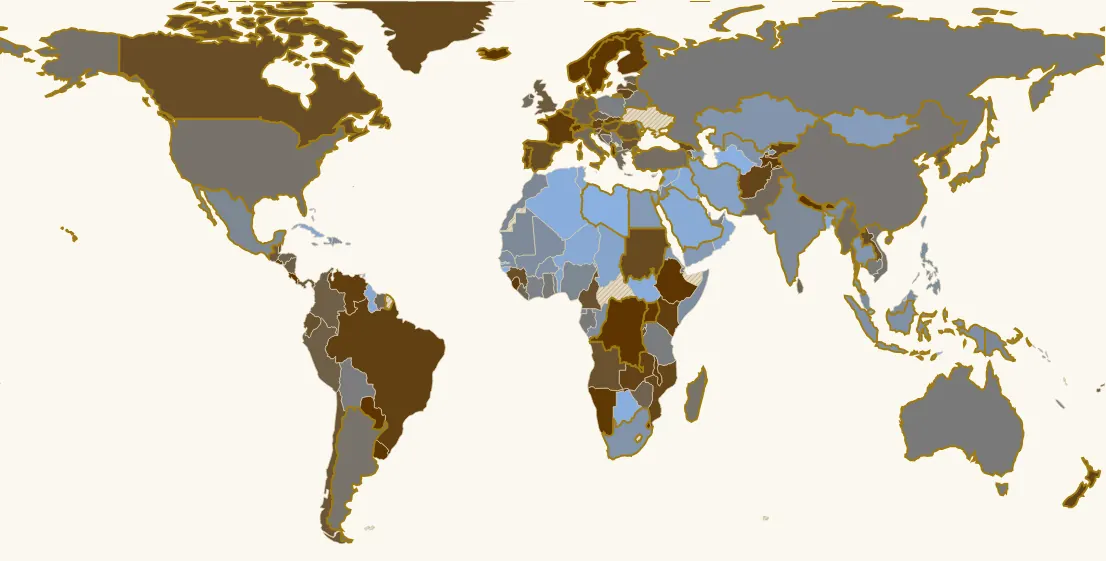
In 2024, 169 countries have a value. Highest: Albania (100 %), Bhutan (100 %), Congo - Kinshasa (100 %). Lowest: Timor-Leste (0 %), Turkmenistan (0 %), Libya (0 %). World: 41 %. France: 95 % (19th of 169).
Country ranking in 2024
| Rank | Country | Value |
|---|---|---|
| 1 | Albania | 100 % |
| 2 | Bhutan | 100 % |
| 3 | Congo - Kinshasa | 100 % |
| 4 | Ethiopia | 100 % |
| 5 | Iceland | 100 % |
| 6 | Nepal | 100 % |
| 7 | Paraguay | 100 % |
| 8 | Costa Rica | 100 % |
| 9 | Uruguay | 99 % |
| 10 | Sweden its history → | 99 % |
| 11 | Norway | 99 % |
| 12 | Switzerland its history → | 98 % |
| 13 | Namibia | 98 % |
| 14 | Uganda | 97 % |
| 15 | Eswatini | 97 % |
| 16 | Malawi | 96 % |
| 17 | Finland | 95 % |
| 18 | Sierra Leone | 95 % |
| 19 | France its history → | 95 % |
| 20 | Tajikistan | 95 % |
| 21 | Kenya | 92 % |
| 22 | Venezuela | 91 % |
| 23 | El Salvador | 91 % |
| 24 | Luxembourg | 91 % |
| 25 | Brazil | 89 % |
| 26 | Denmark | 89 % |
| 27 | Kyrgyzstan | 89 % |
| 28 | Zambia | 88 % |
| 29 | Belize | 87 % |
| 30 | Afghanistan | 87 % |
| 31 | Austria | 86 % |
| 32 | New Zealand | 86 % |
| 33 | Slovakia | 86 % |
| 34 | Portugal its history → | 85 % |
| 35 | Lithuania | 84 % |
| 36 | Mozambique | 83 % |
| 37 | Greenland | 83 % |
| 38 | Georgia | 80 % |
| 39 | Sudan | 80 % |
| 40 | Canada | 78 % |
| 41 | Spain its history → | 77 % |
| 42 | Laos | 77 % |
| 43 | Belgium | 76 % |
| 44 | Slovenia | 76 % |
| 45 | Burundi | 76 % |
| 46 | Guinea | 75 % |
| 47 | Angola | 74 % |
| 48 | Hungary its history → | 74 % |
| 49 | Latvia | 74 % |
| 50 | Croatia | 73 % |
| 51 | Cameroon | 73 % |
| 52 | Ecuador | 72 % |
| 53 | Bulgaria | 71 % |
| 54 | Chile | 70 % |
| 55 | Guatemala | 68 % |
| 56 | Panama | 68 % |
| 57 | Romania | 67 % |
| 58 | United Kingdom | 65 % |
| 59 | Fiji | 64 % |
| 60 | North Korea | 63 % |
| 61 | Nicaragua | 62 % |
| 62 | Colombia | 61 % |
| 63 | Armenia | 61 % |
| 64 | Peru | 60 % |
| 65 | Montenegro | 60 % |
| 66 | Germany its history → | 59 % |
| 67 | Czechia | 58 % |
| 68 | Zimbabwe | 57 % |
| 69 | Estonia | 56 % |
| 70 | Honduras | 55 % |
| 71 | Sri Lanka | 55 % |
| 72 | Liberia | 54 % |
| 73 | Netherlands its history → | 54 % |
| 74 | Suriname | 53 % |
| 75 | Pakistan | 50 % |
| 76 | Italy | 50 % |
| 77 | Rwanda | 50 % |
| 78 | Greece | 49 % |
| 79 | Myanmar (Burma) | 48 % |
| 80 | Ireland | 47 % |
| 81 | Türkiye | 46 % |
| 82 | Lebanon | 44 % |
| 83 | Madagascar | 42 % |
| 84 | Vietnam | 42 % |
| 85 | United States | 42 % |
| 86 | Argentina its history → | 41 % |
| 87 | Bosnia & Herzegovina | 40 % |
| 88 | South Korea | 40 % |
| 89 | North Macedonia | 40 % |
| 90 | Palestine | 39 % |
| 91 | China | 38 % |
| 92 | Belarus | 37 % |
| 93 | Ghana | 36 % |
| 94 | Russia | 36 % |
| 95 | Cambodia | 36 % |
| 96 | Gabon | 35 % |
| 97 | Australia its history → | 35 % |
| 98 | Djibouti | 35 % |
| 99 | Bolivia | 34 % |
| 100 | Tanzania | 33 % |
| 101 | Serbia | 32 % |
| 102 | United Arab Emirates | 32 % |
| 103 | Japan | 31 % |
| 104 | Poland | 31 % |
| 105 | Togo | 30 % |
| 106 | Côte d’Ivoire | 29 % |
| 107 | New Caledonia | 27 % |
| 108 | Equatorial Guinea | 27 % |
| 109 | Nigeria | 25 % |
| 110 | Mexico | 25 % |
| 111 | Morocco | 24 % |
| 112 | Jordan | 24 % |
| 113 | Cyprus | 24 % |
| 114 | Papua New Guinea | 24 % |
| 115 | Mauritania | 23 % |
| 116 | India its history → | 23 % |
| 117 | Congo - Brazzaville | 21 % |
| 118 | Somalia | 21 % |
| 119 | Philippines | 21 % |
| 120 | Malaysia | 20 % |
| 121 | Senegal | 20 % |
| 122 | Mali | 20 % |
| 123 | Dominican Republic | 19 % |
| 124 | Haiti | 19 % |
| 125 | Indonesia | 18 % |
| 126 | Burkina Faso | 17 % |
| 127 | Uzbekistan | 16 % |
| 128 | South Africa | 16 % |
| 129 | Malta | 16 % |
| 130 | Kazakhstan | 15 % |
| 131 | Taiwan | 15 % |
| 132 | Thailand | 15 % |
| 133 | Israel | 14 % |
| 134 | Jamaica | 13 % |
| 135 | Azerbaijan | 12 % |
| 136 | Egypt | 11 % |
| 137 | Yemen | 11 % |
| 138 | Eritrea | 11 % |
| 139 | Moldova | 11 % |
| 140 | Solomon Islands | 9.1 % |
| 141 | Mongolia | 8.8 % |
| 142 | Iran | 7.2 % |
| 143 | Puerto Rico | 6 % |
| 144 | Chad | 5.4 % |
| 145 | Oman | 4.9 % |
| 146 | Singapore | 4.9 % |
| 147 | Tunisia | 4.4 % |
| 148 | Benin | 4 % |
| 149 | Cuba | 4 % |
| 150 | Qatar | 4 % |
| 151 | Syria | 3.5 % |
| 152 | Niger | 3.2 % |
| 153 | Guyana | 2.9 % |
| 154 | Kuwait | 2.2 % |
| 155 | Saudi Arabia | 2.2 % |
| 156 | Bangladesh | 1.9 % |
| 157 | South Sudan | 1.8 % |
| 158 | Bermuda | 1.6 % |
| 159 | Iraq | 1.6 % |
| 160 | Algeria | 1.1 % |
| 161 | Bahamas | 0.9 % |
| 162 | Botswana | 0.3 % |
| 163 | Brunei | 0.2 % |
| 164 | Trinidad & Tobago | 0.1 % |
| 165 | Gambia | 0 % |
| 166 | Guinea-Bissau | 0 % |
| 167 | Libya | 0 % |
| 168 | Turkmenistan | 0 % |
| 169 | Timor-Leste | 0 % |
9 countries or territories have no value that year.
Continent averages
| World | 41 % |
| Europe (average) | 61 % |
| Africa (average) | 26 % |
| Americas (average) | 51 % |
| Asia (average) | 32 % |
| Oceania (average) | 42 % |
Understanding this map
Electricity or all energy?
Electricity is only part of the energy a country uses, often under a quarter: cars, trucks, planes, gas or oil heating and much of industry burn fossil fuels directly. Hence striking gaps: in 2023, French electricity is over 90% low-carbon, but only half of all the energy used in France is. Decarbonising therefore means both producing clean electricity and electrifying what still burns oil or gas.
The sources
“Low-carbon” groups nuclear and renewables, which emit very little CO₂ while running. Renewables include hydro, wind and solar, but also biomass and geothermal. Nuclear is not renewable (it uses uranium) but it is low-carbon. Hovering over a country gives its full mix for the year shown.
Things to spot
Countries of mountains and big rivers (Norway, Paraguay, Brazil, Switzerland) have long run on hydro; France switched to nuclear within fifteen years after the 1973 oil shock; solar and wind, almost nil before 2005, have risen very fast since 2015 as their costs fell. The “fossil” option shows the other side: Gulf states, South Africa and Poland remain heavily dependent on coal, oil or gas.
Limits
For “all energy”, Our World in Data converts nuclear and renewable electricity into the fossil energy that would have been burnt to produce it (the “substitution” method); other conventions give lower shares. This base only covers about 80 countries, few of them in Africa: a continent's average only includes the countries available. Traditional firewood, still widely used in poor countries, is not counted.
Sources : Our World in Data, d’après Ember et Energy Institute (CC BY 4.0)
In the same theme : Energy mix
All maps
Page updated on 2026-11-03.