Public social spending
Pensions, health, family benefits, unemployment, disability, housing, minimum income… paid by the state and social security, as a share of the wealth produced (GDP).
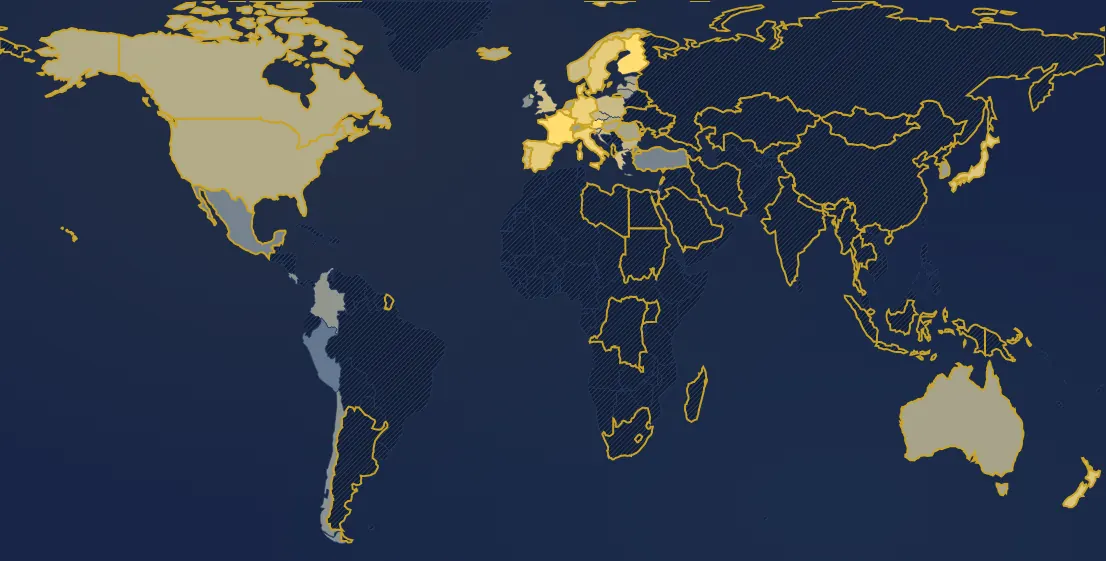
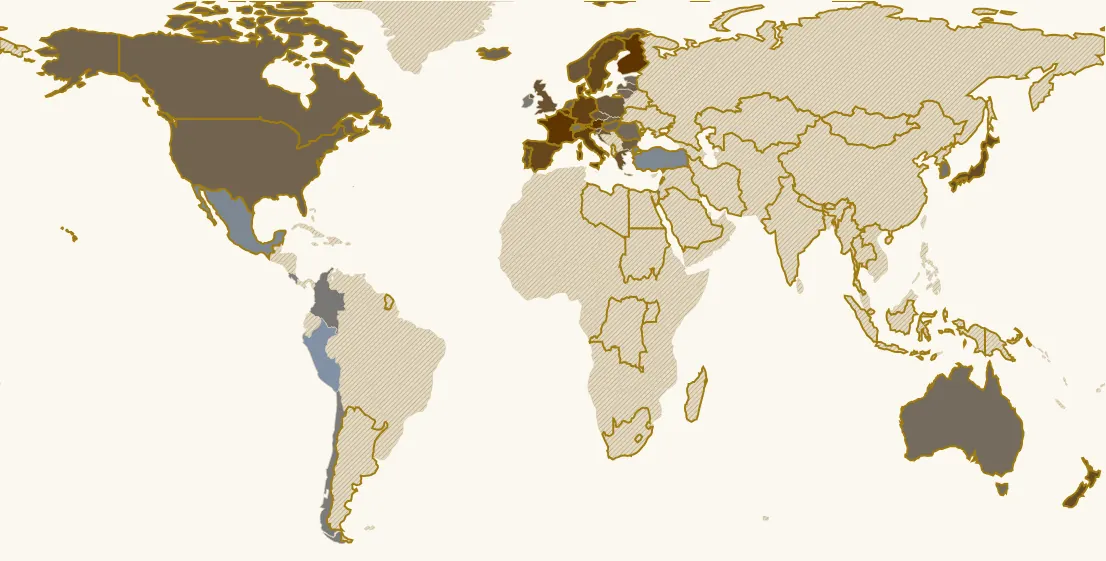
In 2023, 42 countries have a value. Highest: Finland (30.9 %), France (30.6 %), Austria (30.3 %). Lowest: Peru (7.5 %), Türkiye (10 %), Mexico (10 %). France: 30.6 % (2nd of 42).
Country ranking in 2023
| Rank | Country | Value |
|---|---|---|
| 1 | Finland | 30.9 % |
| 2 | France its history → | 30.6 % |
| 3 | Austria | 30.3 % |
| 4 | Belgium | 28.3 % |
| 5 | Italy | 27.5 % |
| 6 | Germany its history → | 27.3 % |
| 7 | Denmark | 26.3 % |
| 8 | Spain its history → | 25.9 % |
| 9 | Sweden its history → | 25.8 % |
| 10 | Japan | 24.7 % |
| 11 | New Zealand | 24.6 % |
| 12 | Greece | 23.7 % |
| 13 | Luxembourg | 23.4 % |
| 14 | United Kingdom | 23 % |
| 15 | Portugal its history → | 23 % |
| 16 | Slovenia | 22.6 % |
| 17 | Croatia | 22.5 % |
| 18 | Norway | 22.3 % |
| 19 | Poland | 21.9 % |
| 20 | Czechia | 21.6 % |
| 21 | Bulgaria | 20.5 % |
| 22 | Latvia | 19.7 % |
| 23 | Canada | 19.3 % |
| 24 | Slovakia | 19.3 % |
| 25 | United States | 19 % |
| 26 | Iceland | 18.6 % |
| 27 | Netherlands its history → | 18.4 % |
| 28 | Hungary its history → | 18.1 % |
| 29 | Romania | 17.6 % |
| 30 | Estonia | 17.2 % |
| 31 | Australia its history → | 17.1 % |
| 32 | Lithuania | 16.9 % |
| 33 | Israel | 16.3 % |
| 34 | Switzerland its history → | 15.5 % |
| 35 | South Korea | 15.4 % |
| 36 | Colombia | 14.1 % |
| 37 | Ireland | 13.4 % |
| 38 | Chile | 12.9 % |
| 39 | Costa Rica | 12.6 % |
| 40 | Mexico | 10 % |
| 41 | Türkiye | 10 % |
| 42 | Peru | 7.5 % |
136 countries or territories have no value that year.
Continent averages
| Europe (GDP-weighted average) | 23.5 % |
| Americas (GDP-weighted average) | 17.8 % |
| Oceania (GDP-weighted average) | 18.1 % |
Understanding this map
What this figure measures
This is the OECD figure, designed to compare different systems: the same categories of spending are counted everywhere, whether they go through the state or through social security funds. Pensions are the largest item, ahead of health (which therefore also appears in the “Health” view). Two limits: pensions paid by compulsory private funds (Netherlands, Switzerland, Australia) are not counted here, and benefits are taxed to varying degrees. Once these effects are accounted for, the gap between France and the United States narrows considerably.
The birth of the welfare state
In 1880 the state spent almost nothing on social protection (under 1% of GDP everywhere). Bismarck's Germany created the first social insurance schemes in the 1880s; by 1930 it already spent nearly 5% of GDP on them. After 1945 social security systems spread: in France spending went from 20% of GDP in 1980 to over 30% today, the highest in the OECD, peaking at 35% during the Covid crisis in 2020.
Limits
The series only covers OECD countries (about forty), hence no world average. Before 1960 it relies on historian Peter Lindert's reconstructions for about fifteen countries, one value every ten years, joined with straight lines; between 1930 and 1960 there are no data.
Sources : OCDE (SOCX) et séries historiques (Lindert), via Our World in Data
In the same theme : Public finances
All maps
Page updated on 2026-11-03.