Public debt per person
Public debt divided by the population, in dollars adjusted for inflation and the cost of living.
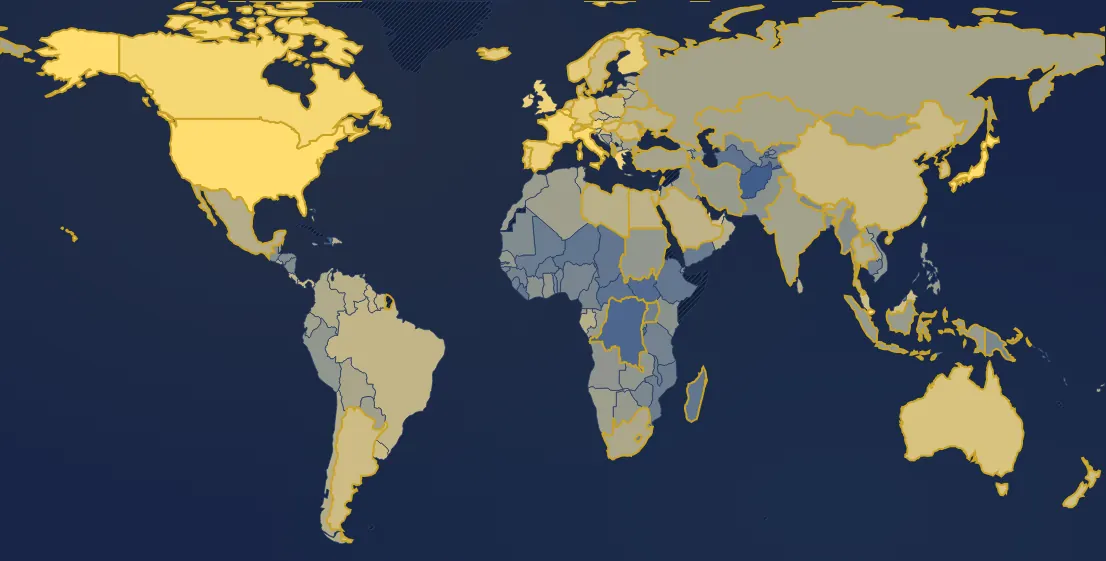
In 2024, 163 countries have a value. Highest: Singapore (220,000 $), Japan (109,000 $), United States (92,300 $). Lowest: Afghanistan (181 $), Congo - Kinshasa (338 $), Burundi (361 $). World (population-weighted average): 18,000 $. France: 61,600 $ (7th of 163).
Country ranking in 2024
| Rank | Country | Value |
|---|---|---|
| 1 | Singapore | 220,000 $ |
| 2 | Japan | 109,000 $ |
| 3 | United States | 92,300 $ |
| 4 | Italy | 71,900 $ |
| 5 | Belgium | 65,900 $ |
| 6 | Canada | 63,100 $ |
| 7 | France its history → | 61,600 $ |
| 8 | Greece | 58,400 $ |
| 9 | United Kingdom | 53,200 $ |
| 10 | Austria | 51,400 $ |
| 11 | Spain its history → | 49,100 $ |
| 12 | Ireland | 47,400 $ |
| 13 | Finland | 45,900 $ |
| 14 | Qatar | 45,700 $ |
| 15 | Germany its history → | 40,100 $ |
| 16 | Portugal its history → | 39,700 $ |
| 17 | Norway | 38,900 $ |
| 18 | Iceland | 38,800 $ |
| 19 | Cyprus | 34,700 $ |
| 20 | Luxembourg | 33,700 $ |
| 21 | Slovenia | 32,300 $ |
| 22 | Israel | 32,000 $ |
| 23 | Switzerland its history → | 30,800 $ |
| 24 | Netherlands its history → | 30,600 $ |
| 25 | Hungary its history → | 29,900 $ |
| 26 | Australia its history → | 29,900 $ |
| 27 | Malta | 27,800 $ |
| 28 | Bahamas | 26,700 $ |
| 29 | Poland | 24,900 $ |
| 30 | Croatia | 24,600 $ |
| 31 | New Zealand | 24,200 $ |
| 32 | Malaysia | 23,900 $ |
| 33 | South Korea | 23,600 $ |
| 34 | Denmark | 23,200 $ |
| 35 | Slovakia | 23,100 $ |
| 36 | Argentina its history → | 22,500 $ |
| 37 | Romania | 22,200 $ |
| 38 | United Arab Emirates | 22,000 $ |
| 39 | Uruguay | 22,000 $ |
| 40 | Taiwan | 21,300 $ |
| 41 | China | 21,100 $ |
| 42 | Sweden its history → | 20,900 $ |
| 43 | Czechia | 20,800 $ |
| 44 | Panama | 20,600 $ |
| 45 | Trinidad & Tobago | 20,500 $ |
| 46 | Latvia | 18,200 $ |
| 47 | Lithuania | 17,900 $ |
| 48 | Lebanon | 17,600 $ |
| 49 | Brazil | 17,200 $ |
| 50 | Guyana | 17,100 $ |
| 51 | Suriname | 16,900 $ |
| 52 | Bhutan | 16,700 $ |
| 53 | Montenegro | 16,700 $ |
| 54 | Saudi Arabia | 16,400 $ |
| 55 | Costa Rica | 16,100 $ |
| 56 | Egypt | 15,300 $ |
| 57 | Ukraine its history → | 14,700 $ |
| 58 | Libya | 14,200 $ |
| 59 | Dominican Republic | 14,200 $ |
| 60 | Venezuela | 14,100 $ |
| 61 | Sri Lanka | 13,900 $ |
| 62 | Gabon | 13,800 $ |
| 63 | Thailand | 13,700 $ |
| 64 | North Macedonia | 13,400 $ |
| 65 | Oman | 13,000 $ |
| 66 | Mexico | 12,900 $ |
| 67 | Chile | 12,600 $ |
| 68 | Serbia | 11,900 $ |
| 69 | Colombia | 11,300 $ |
| 70 | Belarus | 11,200 $ |
| 71 | Fiji | 11,200 $ |
| 72 | Tunisia | 10,600 $ |
| 73 | Albania | 10,600 $ |
| 74 | South Africa | 10,300 $ |
| 75 | El Salvador | 10,200 $ |
| 76 | Estonia | 9,720 $ |
| 77 | Bolivia | 9,650 $ |
| 78 | Armenia | 9,640 $ |
| 79 | Georgia | 9,480 $ |
| 80 | Jordan | 9,130 $ |
| 81 | Kazakhstan | 8,760 $ |
| 82 | Laos | 8,540 $ |
| 83 | Russia | 8,470 $ |
| 84 | Türkiye | 8,470 $ |
| 85 | Bulgaria | 8,210 $ |
| 86 | Belize | 8,100 $ |
| 87 | India its history → | 7,980 $ |
| 88 | Ecuador | 7,660 $ |
| 89 | Paraguay | 7,300 $ |
| 90 | Jamaica | 7,170 $ |
| 91 | Algeria | 7,130 $ |
| 92 | Namibia | 6,960 $ |
| 93 | Mongolia | 6,550 $ |
| 94 | Moldova | 6,390 $ |
| 95 | Morocco | 6,140 $ |
| 96 | Bosnia & Herzegovina | 6,030 $ |
| 97 | Iran | 5,970 $ |
| 98 | Philippines | 5,920 $ |
| 99 | Congo - Brazzaville | 5,900 $ |
| 100 | Indonesia | 5,820 $ |
| 101 | Iraq | 5,820 $ |
| 102 | Equatorial Guinea | 5,630 $ |
| 103 | Botswana | 5,510 $ |
| 104 | Senegal | 5,110 $ |
| 105 | Ghana | 4,980 $ |
| 106 | Sudan | 4,890 $ |
| 107 | Peru | 4,840 $ |
| 108 | Zambia | 4,660 $ |
| 109 | Azerbaijan | 4,610 $ |
| 110 | Angola | 4,590 $ |
| 111 | Vietnam | 4,510 $ |
| 112 | Côte d’Ivoire | 3,990 $ |
| 113 | Pakistan | 3,880 $ |
| 114 | Eswatini | 3,860 $ |
| 115 | Kenya | 3,820 $ |
| 116 | Guatemala | 3,560 $ |
| 117 | Uzbekistan | 3,420 $ |
| 118 | Bangladesh | 3,400 $ |
| 119 | Myanmar (Burma) | 3,130 $ |
| 120 | Honduras | 3,100 $ |
| 121 | Nicaragua | 3,000 $ |
| 122 | Mauritania | 2,890 $ |
| 123 | Kyrgyzstan | 2,580 $ |
| 124 | Zimbabwe | 2,430 $ |
| 125 | Nepal | 2,420 $ |
| 126 | Papua New Guinea | 2,310 $ |
| 127 | Gambia | 2,300 $ |
| 128 | Djibouti | 2,280 $ |
| 129 | Nigeria | 2,230 $ |
| 130 | Guinea-Bissau | 2,210 $ |
| 131 | Rwanda | 2,190 $ |
| 132 | Cameroon | 2,130 $ |
| 133 | Benin | 2,110 $ |
| 134 | Togo | 2,010 $ |
| 135 | Guinea | 1,930 $ |
| 136 | Cambodia | 1,820 $ |
| 137 | Tanzania | 1,790 $ |
| 138 | Lesotho | 1,580 $ |
| 139 | Uganda | 1,480 $ |
| 140 | Sierra Leone | 1,450 $ |
| 141 | Vanuatu | 1,440 $ |
| 142 | Malawi | 1,420 $ |
| 143 | Mozambique | 1,390 $ |
| 144 | Burkina Faso | 1,340 $ |
| 145 | Kuwait | 1,320 $ |
| 146 | Mali | 1,280 $ |
| 147 | Brunei | 1,270 $ |
| 148 | Yemen | 1,210 $ |
| 149 | Tajikistan | 1,180 $ |
| 150 | Liberia | 935 $ |
| 151 | Ethiopia | 932 $ |
| 152 | Chad | 881 $ |
| 153 | Niger | 837 $ |
| 154 | Madagascar | 835 $ |
| 155 | Turkmenistan | 736 $ |
| 156 | Central African Republic | 675 $ |
| 157 | Timor-Leste | 569 $ |
| 158 | Solomon Islands | 556 $ |
| 159 | Haiti | 417 $ |
| 160 | South Sudan | 403 $ |
| 161 | Burundi | 361 $ |
| 162 | Congo - Kinshasa | 338 $ |
| 163 | Afghanistan | 181 $ |
15 countries or territories have no value that year.
Continent averages
| World (population-weighted average) | 18,000 $ |
| Europe (average) | 32,200 $ |
| Africa (average) | 3,940 $ |
| Americas (average) | 41,800 $ |
| Asia (average) | 14,300 $ |
| Oceania (average) | 21,600 $ |
Understanding this map
How this figure is computed
It is debt as a % of GDP multiplied by GDP per person (“Wealth” theme): the share of public debt that falls to each resident, babies included. Amounts are in constant dollars adjusted for the cost of living, like GDP, so countries and periods can be compared. It is not a sum everyone would have to repay: debt is mostly refinanced, and often held by residents themselves (savings, life insurance, banks).
Rich countries owe the most
Per person, the heaviest debts are those of rich countries (Japan, United States, Italy, Belgium, Canada, France…), because lenders trust them and their GDP is high. A low debt per person is not a sign of good health: many poor countries simply cannot borrow more, or only at very high rates. To judge the burden of debt, the “% of GDP” view says more.
Limits
This is gross debt: it does not subtract what the state owns. Norway's debt is about 40% of GDP, but it has a sovereign wealth fund worth more than three times its GDP. Depending on the country, figures cover all of government or only the central state, and older series are historians' reconstructions. Before 1950 few countries are covered: the world average is only shown in years when the available countries make up at least 60% of world GDP (from 1929), and likewise for each continent. For countries missing from the IMF historical database, the series starts in 1980 (World Economic Outlook).
Sources : FMI, Public Finances in Modern History (Mauro et al.) ; World Economic Outlook pour les pays absents · GDP per person: Gapminder
In the same theme : Public finances
All maps
Page updated on 2026-11-03.