Share of people with no religion
Atheists, agnostics and people who belong to no religion, as a share of the population (Pew Research Center estimates). Atheists are not counted separately.
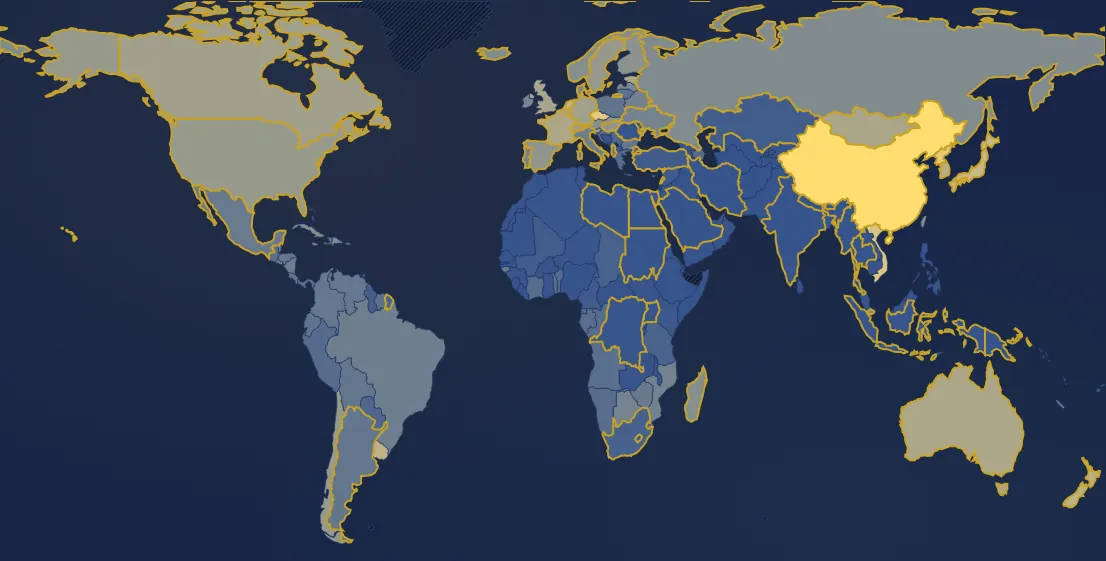
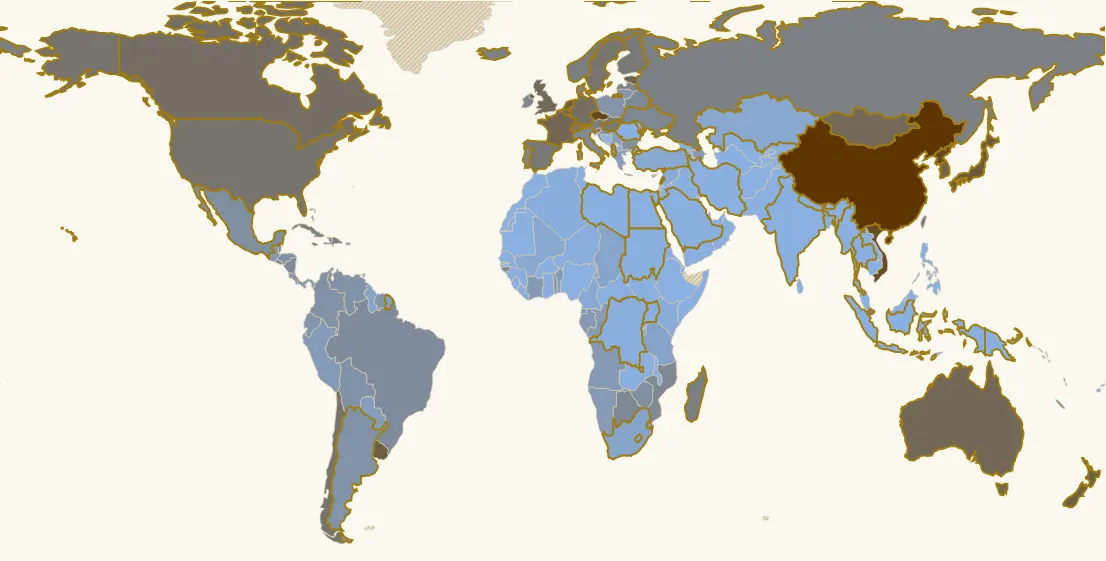
In 2020, 171 countries have a value. Highest: China (90 %), Czechia (73 %), North Korea (73 %). Lowest: Thailand (0 %), Somalia (0 %), Sierra Leone (0 %). World (population-weighted average): 24 %. France: 43 % (11th of 171).
Country ranking in 2020
| Rank | Country | Value |
|---|---|---|
| 1 | China | 90 % |
| 2 | Czechia | 73 % |
| 3 | North Korea | 73 % |
| 4 | Vietnam | 68 % |
| 5 | Japan | 57 % |
| 6 | Netherlands its history → | 54 % |
| 7 | Uruguay | 52 % |
| 8 | New Zealand | 51 % |
| 9 | South Korea | 48 % |
| 10 | Estonia | 44 % |
| 11 | France its history → | 43 % |
| 12 | Australia its history → | 42 % |
| 13 | Mongolia | 41 % |
| 14 | United Kingdom | 40 % |
| 15 | Belgium | 39 % |
| 16 | Germany its history → | 36 % |
| 17 | Canada | 35 % |
| 18 | Slovenia | 32 % |
| 19 | Switzerland its history → | 31 % |
| 20 | Chile | 30 % |
| 21 | United States | 30 % |
| 22 | Sweden its history → | 29 % |
| 23 | Hungary its history → | 27 % |
| 24 | Spain its history → | 26 % |
| 25 | Finland | 25 % |
| 26 | Luxembourg | 25 % |
| 27 | Slovakia | 25 % |
| 28 | Jamaica | 24 % |
| 29 | Taiwan | 23 % |
| 30 | Austria | 22 % |
| 31 | Cuba | 22 % |
| 32 | Madagascar | 22 % |
| 33 | Norway | 22 % |
| 34 | Dominican Republic | 20 % |
| 35 | Iceland | 20 % |
| 36 | Russia | 20 % |
| 37 | Singapore | 20 % |
| 38 | Denmark | 17 % |
| 39 | Latvia | 17 % |
| 40 | Belize | 16 % |
| 41 | Ireland | 16 % |
| 42 | Botswana | 15 % |
| 43 | Ukraine its history → | 15 % |
| 44 | Belarus | 14 % |
| 45 | Mozambique | 14 % |
| 46 | Portugal its history → | 14 % |
| 47 | Brazil | 13 % |
| 48 | Italy | 13 % |
| 49 | Nicaragua | 13 % |
| 50 | Guinea-Bissau | 12 % |
| 51 | El Salvador | 12 % |
| 52 | Mexico | 11 % |
| 53 | New Caledonia | 11 % |
| 54 | Zimbabwe | 11 % |
| 55 | Bulgaria | 10 % |
| 56 | Costa Rica | 10 % |
| 57 | Puerto Rico | 10 % |
| 58 | Colombia | 9.9 % |
| 59 | Honduras | 9.7 % |
| 60 | Venezuela | 9.7 % |
| 61 | Bolivia | 9.5 % |
| 62 | Haiti | 9.4 % |
| 63 | Argentina its history → | 9.2 % |
| 64 | Poland | 8.6 % |
| 65 | Ecuador | 8.4 % |
| 66 | Suriname | 8.1 % |
| 67 | Togo | 8 % |
| 68 | Albania | 7.7 % |
| 69 | Lithuania | 7.1 % |
| 70 | Croatia | 6.7 % |
| 71 | Cyprus | 6.6 % |
| 72 | Panama | 6.2 % |
| 73 | Eswatini | 6.2 % |
| 74 | Angola | 6.1 % |
| 75 | Guatemala | 6 % |
| 76 | Gabon | 5.8 % |
| 77 | Côte d’Ivoire | 5.6 % |
| 78 | Namibia | 5.6 % |
| 79 | Congo - Brazzaville | 5.2 % |
| 80 | Malta | 5.2 % |
| 81 | Peru | 5.1 % |
| 82 | Equatorial Guinea | 5 % |
| 83 | Benin | 4.9 % |
| 84 | Azerbaijan | 4.8 % |
| 85 | Greece | 4.7 % |
| 86 | Israel | 4.4 % |
| 87 | Paraguay | 4.2 % |
| 88 | Serbia | 4 % |
| 89 | Tanzania | 3.5 % |
| 90 | French Guiana | 3.4 % |
| 91 | Chad | 3.1 % |
| 92 | South Africa | 3.1 % |
| 93 | Guyana | 2.9 % |
| 94 | Kazakhstan | 2.5 % |
| 95 | Mali | 2.5 % |
| 96 | Türkiye | 2.5 % |
| 97 | Trinidad & Tobago | 2.4 % |
| 98 | Cameroon | 2.1 % |
| 99 | Syria | 2 % |
| 100 | Bahamas | 1.9 % |
| 101 | Lesotho | 1.7 % |
| 102 | Kenya | 1.6 % |
| 103 | Vanuatu | 1.4 % |
| 104 | Burundi | 1.3 % |
| 105 | Algeria | 1.3 % |
| 106 | Guinea | 1.3 % |
| 107 | Armenia | 1.2 % |
| 108 | Congo - Kinshasa | 1.2 % |
| 109 | Kyrgyzstan | 1.2 % |
| 110 | Niger | 1.2 % |
| 111 | Djibouti | 1.1 % |
| 112 | Eritrea | 1.1 % |
| 113 | Ghana | 1.1 % |
| 114 | Liberia | 1.1 % |
| 115 | Montenegro | 1.1 % |
| 116 | Bosnia & Herzegovina | 1 % |
| 117 | Georgia | 1 % |
| 118 | Rwanda | 1 % |
| 119 | Malawi | 0.9 % |
| 120 | Romania | 0.9 % |
| 121 | Malaysia | 0.8 % |
| 122 | Burkina Faso | 0.6 % |
| 123 | Sudan | 0.6 % |
| 124 | Uzbekistan | 0.6 % |
| 125 | Central African Republic | 0.5 % |
| 126 | North Macedonia | 0.5 % |
| 127 | Nigeria | 0.4 % |
| 128 | South Sudan | 0.4 % |
| 129 | Tunisia | 0.4 % |
| 130 | United Arab Emirates | 0.3 % |
| 131 | Western Sahara | 0.3 % |
| 132 | Fiji | 0.3 % |
| 133 | Papua New Guinea | 0.3 % |
| 134 | Qatar | 0.3 % |
| 135 | Solomon Islands | 0.3 % |
| 136 | Brunei | 0.2 % |
| 137 | Kuwait | 0.2 % |
| 138 | Moldova | 0.2 % |
| 139 | Ethiopia | 0.1 % |
| 140 | Indonesia | 0.1 % |
| 141 | Cambodia | 0.1 % |
| 142 | Laos | 0.1 % |
| 143 | Sri Lanka | 0.1 % |
| 144 | Morocco | 0.1 % |
| 145 | Myanmar (Burma) | 0.1 % |
| 146 | Mauritania | 0.1 % |
| 147 | Oman | 0.1 % |
| 148 | Saudi Arabia | 0.1 % |
| 149 | Tajikistan | 0.1 % |
| 150 | Turkmenistan | 0.1 % |
| 151 | Timor-Leste | 0.1 % |
| 152 | Uganda | 0.1 % |
| 153 | Yemen | 0.1 % |
| 154 | Zambia | 0.1 % |
| 155 | Afghanistan | 0 % |
| 156 | Bhutan | 0 % |
| 157 | Egypt | 0 % |
| 158 | Gambia | 0 % |
| 159 | India its history → | 0 % |
| 160 | Iran | 0 % |
| 161 | Iraq | 0 % |
| 162 | Jordan | 0 % |
| 163 | Lebanon | 0 % |
| 164 | Libya | 0 % |
| 165 | Nepal | 0 % |
| 166 | Pakistan | 0 % |
| 167 | Philippines | 0 % |
| 168 | Senegal | 0 % |
| 169 | Sierra Leone | 0 % |
| 170 | Somalia | 0 % |
| 171 | Thailand | 0 % |
7 countries or territories have no value that year.
Continent averages
| World (population-weighted average) | 24 % |
| Europe (average) | 23 % |
| Africa (average) | 2.2 % |
| Americas (average) | 19 % |
| Asia (average) | 32 % |
| Oceania (average) | 32 % |
Understanding this map
What these figures measure
This is about affiliation: the religion people identify with or were raised in, not their practice or the strength of their faith. A baptised French person who never goes to church counts as Catholic. From 1900 to 2015 the figures come from the academic Religious Characteristics of States project (Davis Brown and Patrick James): a single method for every country and year, built from censuses, surveys and religious records, colonies and Soviet republics included. For 2010-2020 the map also offers Pew Research Center estimates, with less detail.
No religion, atheists, not stated
“No religion” groups agnostics, the indifferent and atheists; atheists, who assert that God does not exist, are also counted separately. They are far fewer: in France in 2015, 24% with no religion of whom 4% atheists. Their record dates from communist regimes, which imposed atheism: about 30% in Estonia and 22% in Russia around 1980, 16% in North Korea today. The “not stated” category mostly gathers people who did not answer the census question: 48% in Czechia in 2010, 31% in Russia in 2015. Many are probably non-religious, but there is no way to know. Finally, this series partly relies on church records (baptisms, registered members), which overstates religious affiliation in highly secular countries. In France it counts 24% with no religion in 2015, whereas surveys where people describe themselves find far more: 43% according to Pew in 2020, 51% of 18-59 year-olds according to Insee (Trajectoires et origines survey, 2019-2020). Likewise, opinion surveys find more atheists than the 4% of this series.
The big changes
In Africa, the Christian share rises from 8% in 1900 to almost half in 2015, at the expense of traditional religions. Communist regimes pushed religion back by force: in Russia, 40% with no religion in 1950, 46% in 1980, then 8% in 2015; in Albania, the first officially atheist state (1967), 66% in 1980. In Western Europe secularisation is slower but steady: in the Netherlands, people with no religion go from 17% in 1950 to 52% in 2015. South Korea goes from 6% Christian in 1950 to 35% in 2015. Worldwide the Muslim share rises (15% in 1900, 23% in 2015), mainly because Muslim populations are young and have more children.
Limits
Counting religions is hard, and sources differ widely. The map's two series are therefore not joined end to end: from 2010 to 2015, the tooltip gives the other source's estimate. In China, the 1900-2015 series counts about 40% with no religion and a fifth following folk religions; Pew counts nearly 90%. In Estonia, 53% with no religion and 17% not stated on one side, 32% with no religion on the other. In Japan, many people belong to both Buddhism and Shinto without calling themselves religious. Before 1950, and in countries without a religious census, figures are reconstructions.
Sources : Religious Characteristics of States, Demographics v2.0 (Brown et James), via ARDA · 2010-2020: Pew Research Center, via Our World in Data
In the same theme : Religions
All maps
Page updated on 2026-11-03.