Public spending on health
Care paid for by the state and compulsory health insurance (hospitals, doctors, medicines), as a share of the wealth produced (GDP).
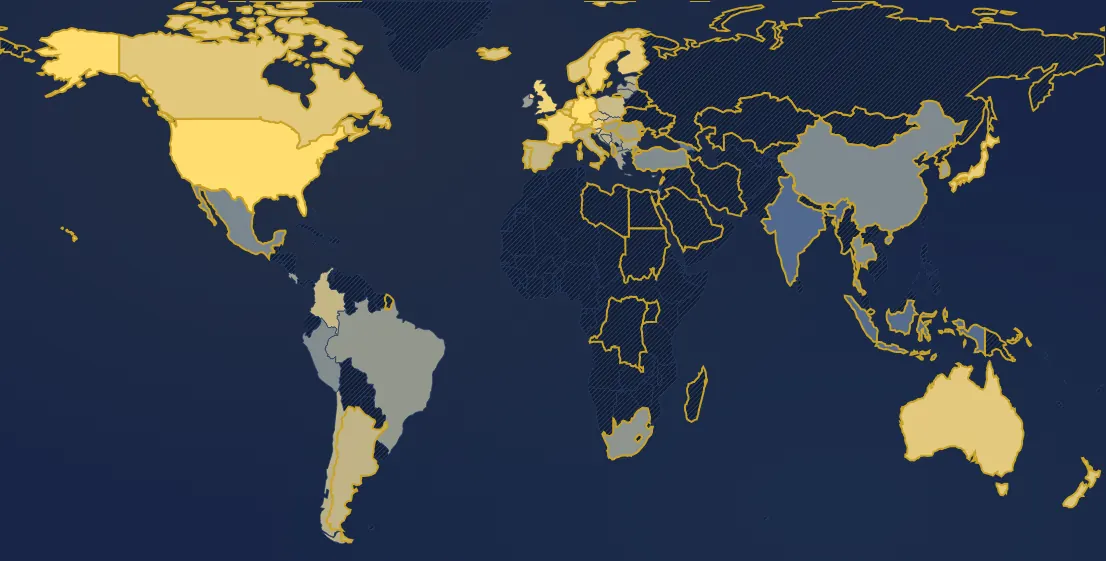
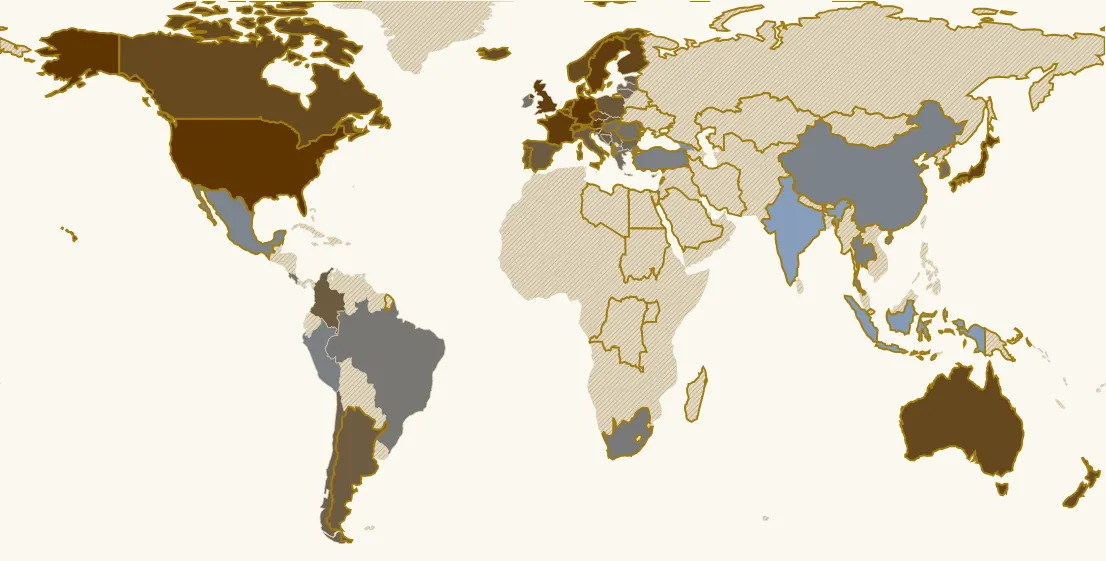
In 2025, 58 countries have a value. Highest: United States (14.6 %), Germany (11 %), France (9.4 %). Lowest: India (1.4 %), Indonesia (1.5 %), Georgia (2.2 %). France: 9.4 % (3rd of 58).
Country ranking in 2025
| Rank | Country | Value |
|---|---|---|
| 1 | United States | 14.6 % |
| 2 | Germany its history → | 11 % |
| 3 | France its history → | 9.4 % |
| 4 | Sweden its history → | 9.3 % |
| 5 | United Kingdom | 9.2 % |
| 6 | Austria | 9 % |
| 7 | Japan | 8.7 % |
| 8 | Finland | 8.5 % |
| 9 | Netherlands its history → | 8.5 % |
| 10 | Slovenia | 8.3 % |
| 11 | Australia its history → | 8.2 % |
| 12 | Belgium | 8.2 % |
| 13 | Canada | 8.1 % |
| 14 | Switzerland its history → | 8 % |
| 15 | Norway | 8 % |
| 16 | Denmark | 7.9 % |
| 17 | New Zealand | 7.8 % |
| 18 | Iceland | 7.7 % |
| 19 | Czechia | 7.6 % |
| 20 | Poland | 6.9 % |
| 21 | Montenegro | 6.8 % |
| 22 | Colombia | 6.5 % |
| 23 | Spain its history → | 6.5 % |
| 24 | Portugal its history → | 6.5 % |
| 25 | Croatia | 6.4 % |
| 26 | Slovakia | 6.4 % |
| 27 | Argentina its history → | 6.3 % |
| 28 | Cyprus | 6.3 % |
| 29 | Italy | 6.2 % |
| 30 | Bosnia & Herzegovina | 6.1 % |
| 31 | Estonia | 6.1 % |
| 32 | Chile | 5.9 % |
| 33 | Malta | 5.7 % |
| 34 | Bulgaria | 5.5 % |
| 35 | Lithuania | 5.2 % |
| 36 | Latvia | 5.2 % |
| 37 | Moldova | 5.2 % |
| 38 | Serbia | 5.2 % |
| 39 | Luxembourg | 5.1 % |
| 40 | Greece | 5 % |
| 41 | South Korea | 5 % |
| 42 | Hungary its history → | 4.8 % |
| 43 | Romania | 4.8 % |
| 44 | Costa Rica | 4.7 % |
| 45 | Ireland | 4.7 % |
| 46 | Israel | 4.6 % |
| 47 | Brazil | 4.3 % |
| 48 | North Macedonia | 4.3 % |
| 49 | South Africa | 4.1 % |
| 50 | Albania | 3.6 % |
| 51 | Peru | 3.6 % |
| 52 | Thailand | 3.5 % |
| 53 | Türkiye | 3.5 % |
| 54 | China | 3.4 % |
| 55 | Mexico | 3.2 % |
| 56 | Georgia | 2.2 % |
| 57 | Indonesia | 1.5 % |
| 58 | India its history → | 1.4 % |
120 countries or territories have no value that year.
Continent averages
| Europe (GDP-weighted average) | 7.7 % |
| Americas (GDP-weighted average) | 11.5 % |
| Asia (GDP-weighted average) | 3.4 % |
| Oceania (GDP-weighted average) | 8.1 % |
Understanding this map
What this figure measures
It counts health spending paid by government and by compulsory insurance. What households pay themselves or through voluntary insurance is excluded. Beware the United States: since the Obama reform, employer insurance that became compulsory is counted here, hence the jump from 8% of GDP in 2010 to nearly 16% in 2020.
From almost nothing to 10% of GDP
Before 1930 public health was limited to hygiene and a few hospitals: under 1% of GDP everywhere. Social security (1945 in France), the British NHS (1948), then ageing and medical progress take public spending to 9-11% of GDP in most rich countries today (France 9.4% in 2024).
Limits
This series covers only about sixty countries, mostly OECD members, hence no world average. Missing years between two known values are estimated with a straight line (ten years at most), and the last value is kept for at most three years.
Sources : OCDE et séries historiques (Lindert), via Our World in Data
In the same theme : Public finances
All maps
Page updated on 2026-11-03.