GDP per capita
Everything the country produces in a year, divided by its population, in dollars adjusted for inflation and the cost of living.
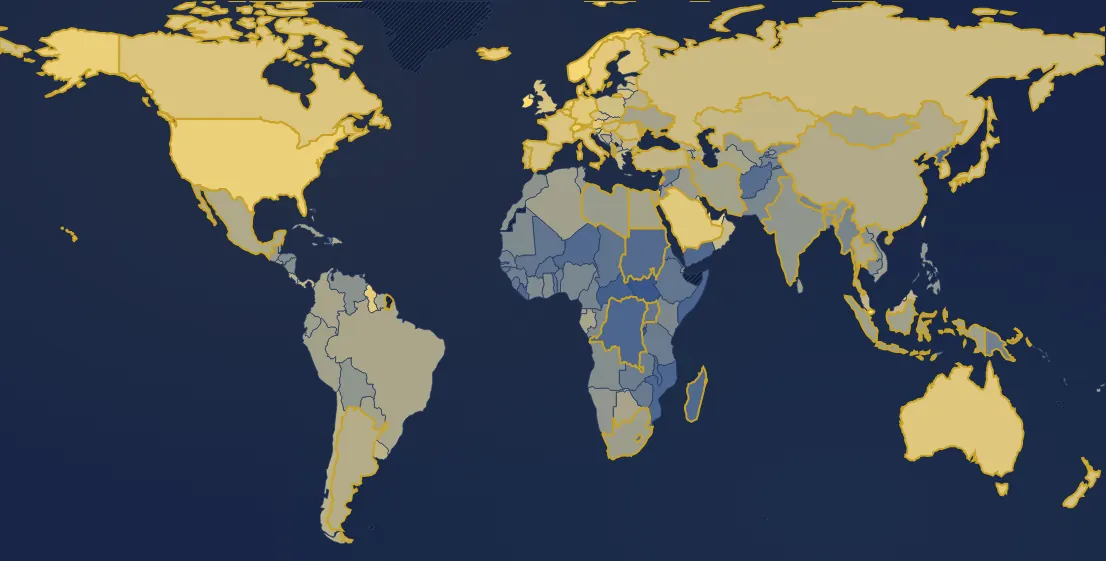
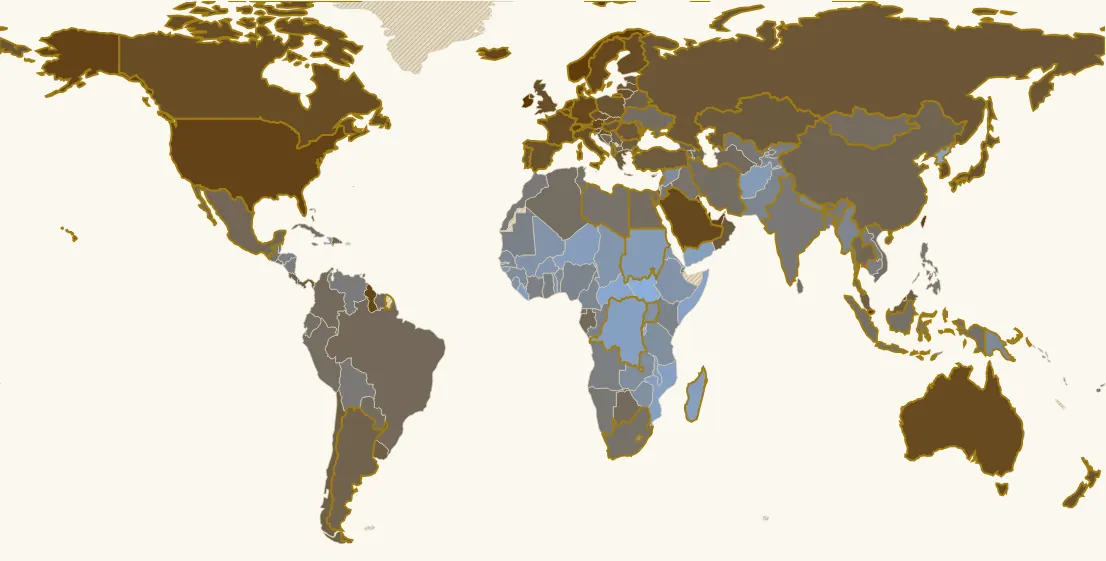
In 2024, 169 countries have a value. Highest: Singapore (133,000 $), Luxembourg (128,000 $), Ireland (115,000 $). Lowest: South Sudan (750 $), Burundi (836 $), Central African Republic (1,110 $). World (population-weighted average): 21,200 $. France: 54,500 $ (24th of 169).
Country ranking in 2024
| Rank | Country | Value |
|---|---|---|
| 1 | Singapore | 133,000 $ |
| 2 | Luxembourg | 128,000 $ |
| 3 | Ireland | 115,000 $ |
| 4 | Qatar | 111,000 $ |
| 5 | Norway | 91,100 $ |
| 6 | Switzerland its history → | 82,000 $ |
| 7 | Taiwan | 79,600 $ |
| 8 | Brunei | 79,200 $ |
| 9 | United States | 75,500 $ |
| 10 | Denmark | 73,700 $ |
| 11 | Netherlands its history → | 70,900 $ |
| 12 | Guyana | 70,300 $ |
| 13 | United Arab Emirates | 68,600 $ |
| 14 | Iceland | 65,600 $ |
| 15 | Austria | 63,300 $ |
| 16 | Sweden its history → | 63,300 $ |
| 17 | Belgium | 63,100 $ |
| 18 | Germany its history → | 62,800 $ |
| 19 | Saudi Arabia | 62,700 $ |
| 20 | Malta | 60,500 $ |
| 21 | Australia its history → | 60,100 $ |
| 22 | Canada | 56,700 $ |
| 23 | Finland | 55,600 $ |
| 24 | France its history → | 54,500 $ |
| 25 | Cyprus | 53,300 $ |
| 26 | Italy | 53,100 $ |
| 27 | South Korea | 52,600 $ |
| 28 | United Kingdom | 52,500 $ |
| 29 | Slovenia | 48,500 $ |
| 30 | Spain its history → | 48,400 $ |
| 31 | New Zealand | 48,200 $ |
| 32 | Czechia | 48,000 $ |
| 33 | Israel | 47,300 $ |
| 34 | Lithuania | 47,200 $ |
| 35 | Japan | 46,100 $ |
| 36 | Kuwait | 45,400 $ |
| 37 | Poland | 45,100 $ |
| 38 | Croatia | 42,600 $ |
| 39 | Portugal its history → | 41,900 $ |
| 40 | Russia | 41,700 $ |
| 41 | Estonia | 41,500 $ |
| 42 | Hungary its history → | 40,700 $ |
| 43 | Romania | 40,600 $ |
| 44 | Slovakia | 40,300 $ |
| 45 | Latvia | 38,900 $ |
| 46 | Greece | 37,800 $ |
| 47 | Oman | 36,700 $ |
| 48 | Panama | 36,400 $ |
| 49 | Bahamas | 36,200 $ |
| 50 | Kazakhstan | 35,900 $ |
| 51 | Türkiye | 35,300 $ |
| 52 | Bulgaria | 34,100 $ |
| 53 | Malaysia | 34,100 $ |
| 54 | Uruguay | 32,000 $ |
| 55 | Trinidad & Tobago | 31,700 $ |
| 56 | Chile | 30,200 $ |
| 57 | Belarus | 29,000 $ |
| 58 | Montenegro | 27,900 $ |
| 59 | Costa Rica | 27,000 $ |
| 60 | Serbia | 26,900 $ |
| 61 | Argentina its history → | 26,500 $ |
| 62 | Georgia | 25,000 $ |
| 63 | North Macedonia | 24,500 $ |
| 64 | Dominican Republic | 24,200 $ |
| 65 | China | 23,800 $ |
| 66 | Azerbaijan | 22,100 $ |
| 67 | Mexico | 22,000 $ |
| 68 | Thailand | 21,700 $ |
| 69 | Bosnia & Herzegovina | 20,400 $ |
| 70 | Armenia | 20,100 $ |
| 71 | Brazil | 19,600 $ |
| 72 | Suriname | 19,400 $ |
| 73 | Albania | 18,900 $ |
| 74 | Gabon | 18,900 $ |
| 75 | Colombia | 18,500 $ |
| 76 | Botswana | 18,100 $ |
| 77 | Turkmenistan | 18,000 $ |
| 78 | Egypt | 16,800 $ |
| 79 | Mongolia | 16,800 $ |
| 80 | Moldova | 16,500 $ |
| 81 | Paraguay | 16,300 $ |
| 82 | Ukraine its history → | 16,300 $ |
| 83 | Iran | 16,200 $ |
| 84 | Peru | 15,700 $ |
| 85 | Bhutan | 15,500 $ |
| 86 | Equatorial Guinea | 15,500 $ |
| 87 | Algeria | 15,400 $ |
| 88 | Cuba | 15,100 $ |
| 89 | Indonesia | 14,500 $ |
| 90 | Vietnam | 14,400 $ |
| 91 | Fiji | 14,100 $ |
| 92 | Ecuador | 13,900 $ |
| 93 | Sri Lanka | 13,800 $ |
| 94 | South Africa | 13,600 $ |
| 95 | Belize | 13,300 $ |
| 96 | Iraq | 12,700 $ |
| 97 | Tunisia | 12,700 $ |
| 98 | Guatemala | 12,600 $ |
| 99 | Libya | 12,300 $ |
| 100 | El Salvador | 11,700 $ |
| 101 | Lebanon | 10,700 $ |
| 102 | Uzbekistan | 10,500 $ |
| 103 | Philippines | 10,400 $ |
| 104 | Eswatini | 10,400 $ |
| 105 | Jamaica | 10,300 $ |
| 106 | Namibia | 10,300 $ |
| 107 | Bolivia | 9,840 $ |
| 108 | India its history → | 9,820 $ |
| 109 | Jordan | 9,520 $ |
| 110 | Morocco | 9,070 $ |
| 111 | Laos | 8,610 $ |
| 112 | Venezuela | 8,560 $ |
| 113 | Bangladesh | 8,490 $ |
| 114 | Nicaragua | 7,660 $ |
| 115 | Angola | 7,340 $ |
| 116 | Ghana | 7,060 $ |
| 117 | Kyrgyzstan | 7,050 $ |
| 118 | Cambodia | 7,010 $ |
| 119 | Djibouti | 6,840 $ |
| 120 | Côte d’Ivoire | 6,730 $ |
| 121 | Honduras | 6,590 $ |
| 122 | Mauritania | 6,400 $ |
| 123 | Congo - Brazzaville | 6,180 $ |
| 124 | Kenya | 5,820 $ |
| 125 | Nigeria | 5,670 $ |
| 126 | Pakistan | 5,530 $ |
| 127 | Myanmar (Burma) | 5,280 $ |
| 128 | Nepal | 5,050 $ |
| 129 | Cameroon | 4,920 $ |
| 130 | Tajikistan | 4,760 $ |
| 131 | Senegal | 4,500 $ |
| 132 | Papua New Guinea | 4,300 $ |
| 133 | Timor-Leste | 4,190 $ |
| 134 | Syria | 4,130 $ |
| 135 | Guinea | 4,030 $ |
| 136 | Benin | 3,900 $ |
| 137 | Palestine | 3,850 $ |
| 138 | Zambia | 3,720 $ |
| 139 | Tanzania | 3,710 $ |
| 140 | Zimbabwe | 3,450 $ |
| 141 | Rwanda | 3,260 $ |
| 142 | Vanuatu | 3,170 $ |
| 143 | Sierra Leone | 3,090 $ |
| 144 | Gambia | 3,030 $ |
| 145 | Mali | 2,910 $ |
| 146 | Ethiopia | 2,880 $ |
| 147 | Uganda | 2,880 $ |
| 148 | Togo | 2,850 $ |
| 149 | Haiti | 2,800 $ |
| 150 | Guinea-Bissau | 2,690 $ |
| 151 | Lesotho | 2,640 $ |
| 152 | Chad | 2,610 $ |
| 153 | Burkina Faso | 2,550 $ |
| 154 | Solomon Islands | 2,530 $ |
| 155 | Eritrea | 2,330 $ |
| 156 | Afghanistan | 2,040 $ |
| 157 | Sudan | 1,870 $ |
| 158 | Niger | 1,770 $ |
| 159 | Yemen | 1,700 $ |
| 160 | Liberia | 1,660 $ |
| 161 | Madagascar | 1,660 $ |
| 162 | Malawi | 1,640 $ |
| 163 | North Korea | 1,540 $ |
| 164 | Congo - Kinshasa | 1,500 $ |
| 165 | Mozambique | 1,500 $ |
| 166 | Somalia | 1,410 $ |
| 167 | Central African Republic | 1,110 $ |
| 168 | Burundi | 836 $ |
| 169 | South Sudan | 750 $ |
9 countries or territories have no value that year.
Continent averages
| World (population-weighted average) | 21,200 $ |
| Europe (average) | 47,300 $ |
| Africa (average) | 5,860 $ |
| Americas (average) | 39,200 $ |
| Asia (average) | 17,000 $ |
| Oceania (average) | 43,000 $ |
Understanding this map
What is GDP?
Gross domestic product adds up the value of all goods and services produced in the country in a year: factories, shops, farming, but also public services. Divided by the population, it gives the average output per person.
“PPP” and constant dollars
Amounts are adjusted for purchasing power (a dollar buys as much everywhere, whereas a meal costs far less in India than in Switzerland) and for inflation. So India can be compared with Switzerland, and 1850 with 2024.
It is not what people earn
Part of the wealth produced goes to companies, foreign investors or the state, and it can be very unequally shared. Guyana is the striking case: thanks to oil pumped since 2019, its GDP per person has grown sixfold and overtaken France's, without residents' living standards following. The same goes for Qatar or Luxembourg (with its many cross-border workers). For living standards, see the “Median income” theme. Before 1950, figures are historians' reconstructions (Maddison project): orders of magnitude.
Sources : Gapminder (CC BY 4.0), d’après ONU, HMD, Maddison et autres
In the same theme : Wealth
All maps
Page updated on 2026-11-03.