Public debt
Everything owed by the state, local authorities and social security, as a share of the wealth the country produces in a year (GDP). 100% = a full year of output.
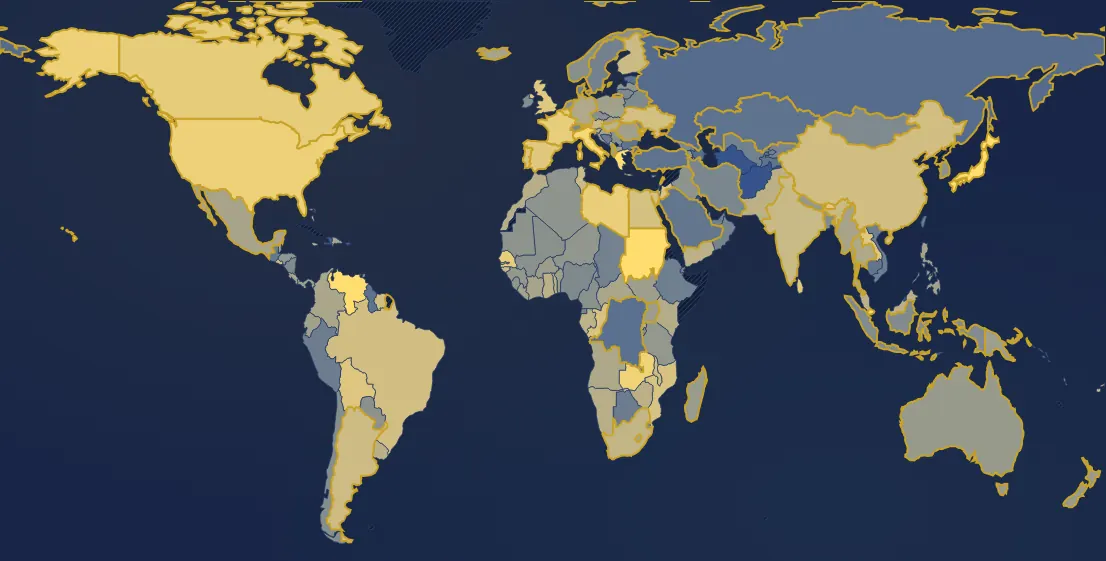
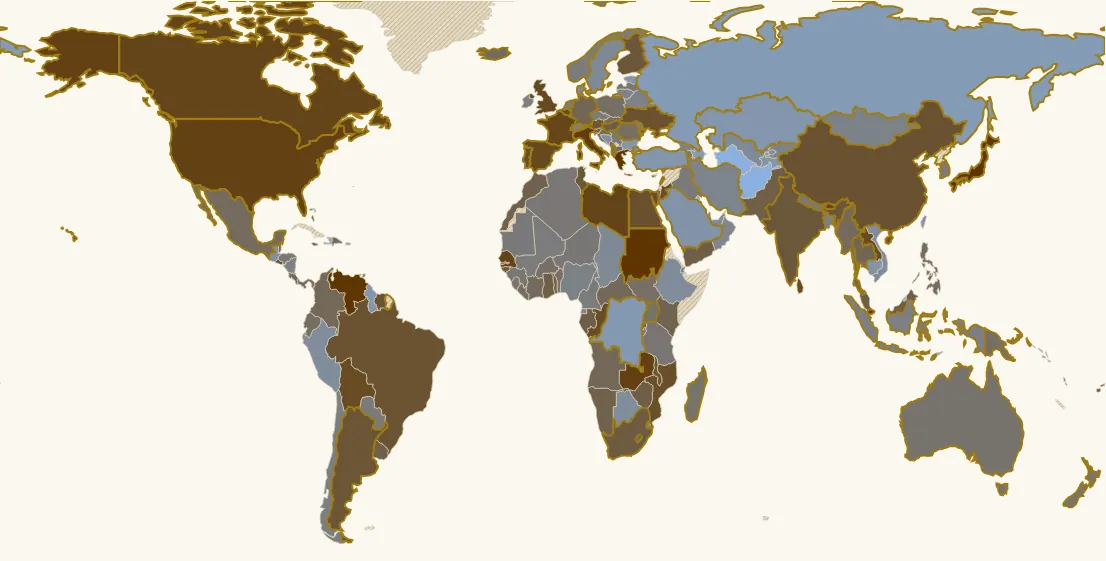
In 2024, 164 countries have a value. Highest: Sudan (261 %), Japan (237 %), Singapore (166 %). Lowest: Brunei (2 %), Kuwait (3 %), Turkmenistan (4 %). World (GDP-weighted average): 84 %. France: 113 % (12th of 164).
Country ranking in 2024
| Rank | Country | Value |
|---|---|---|
| 1 | Sudan | 261 % |
| 2 | Japan | 237 % |
| 3 | Singapore | 166 % |
| 4 | Venezuela | 164 % |
| 5 | Lebanon | 164 % |
| 6 | Greece | 155 % |
| 7 | Italy | 135 % |
| 8 | Zambia | 126 % |
| 9 | United States | 122 % |
| 10 | Libya | 115 % |
| 11 | Senegal | 114 % |
| 12 | France its history → | 113 % |
| 13 | Canada | 111 % |
| 14 | Bhutan | 108 % |
| 15 | Belgium | 105 % |
| 16 | Spain its history → | 102 % |
| 17 | United Kingdom | 101 % |
| 18 | Sri Lanka | 101 % |
| 19 | Laos | 99 % |
| 20 | Bolivia | 98 % |
| 21 | Jordan | 96 % |
| 22 | Congo - Brazzaville | 95 % |
| 23 | Portugal its history → | 95 % |
| 24 | Mozambique | 93 % |
| 25 | Egypt | 91 % |
| 26 | Ukraine its history → | 90 % |
| 27 | China | 88 % |
| 28 | El Salvador | 88 % |
| 29 | Suriname | 87 % |
| 30 | Brazil | 87 % |
| 31 | Malawi | 87 % |
| 32 | Argentina its history → | 85 % |
| 33 | Tunisia | 83 % |
| 34 | Finland | 83 % |
| 35 | Guinea-Bissau | 82 % |
| 36 | India its history → | 81 % |
| 37 | Austria | 81 % |
| 38 | Fiji | 79 % |
| 39 | South Africa | 76 % |
| 40 | Gambia | 76 % |
| 41 | Bahamas | 74 % |
| 42 | Hungary its history → | 74 % |
| 43 | Gabon | 73 % |
| 44 | Yemen | 71 % |
| 45 | Togo | 71 % |
| 46 | Ghana | 71 % |
| 47 | Zimbabwe | 70 % |
| 48 | Malaysia | 70 % |
| 49 | Pakistan | 70 % |
| 50 | Jamaica | 70 % |
| 51 | Uruguay | 69 % |
| 52 | Namibia | 68 % |
| 53 | Morocco | 68 % |
| 54 | Israel | 68 % |
| 55 | Rwanda | 67 % |
| 56 | Slovenia | 67 % |
| 57 | Kenya | 66 % |
| 58 | Cyprus | 65 % |
| 59 | Trinidad & Tobago | 65 % |
| 60 | Germany its history → | 64 % |
| 61 | Thailand | 63 % |
| 62 | Angola | 63 % |
| 63 | Colombia | 61 % |
| 64 | Belize | 61 % |
| 65 | Central African Republic | 61 % |
| 66 | Lesotho | 60 % |
| 67 | Costa Rica | 60 % |
| 68 | Montenegro | 60 % |
| 69 | Côte d’Ivoire | 59 % |
| 70 | Myanmar (Burma) | 59 % |
| 71 | Iceland | 59 % |
| 72 | Dominican Republic | 59 % |
| 73 | Mexico | 58 % |
| 74 | Croatia | 58 % |
| 75 | Slovakia | 57 % |
| 76 | Philippines | 57 % |
| 77 | Panama | 57 % |
| 78 | Liberia | 56 % |
| 79 | Albania | 56 % |
| 80 | Poland | 55 % |
| 81 | Ecuador | 55 % |
| 82 | North Macedonia | 55 % |
| 83 | Romania | 55 % |
| 84 | Benin | 54 % |
| 85 | South Sudan | 54 % |
| 86 | Papua New Guinea | 54 % |
| 87 | Burkina Faso | 53 % |
| 88 | Uganda | 52 % |
| 89 | Madagascar | 50 % |
| 90 | New Zealand | 50 % |
| 91 | Australia its history → | 50 % |
| 92 | Tanzania | 48 % |
| 93 | Armenia | 48 % |
| 94 | Nepal | 48 % |
| 95 | Guinea | 48 % |
| 96 | Niger | 47 % |
| 97 | Honduras | 47 % |
| 98 | Sierra Leone | 47 % |
| 99 | Latvia | 47 % |
| 100 | Algeria | 46 % |
| 101 | Malta | 46 % |
| 102 | Iraq | 46 % |
| 103 | Vanuatu | 45 % |
| 104 | Mauritania | 45 % |
| 105 | Paraguay | 45 % |
| 106 | South Korea | 45 % |
| 107 | Serbia | 44 % |
| 108 | Mali | 44 % |
| 109 | Cameroon | 43 % |
| 110 | Czechia | 43 % |
| 111 | Burundi | 43 % |
| 112 | Netherlands its history → | 43 % |
| 113 | Norway | 43 % |
| 114 | Chile | 42 % |
| 115 | Qatar | 41 % |
| 116 | Ireland | 41 % |
| 117 | Indonesia | 40 % |
| 118 | Bangladesh | 40 % |
| 119 | Nigeria | 39 % |
| 120 | Nicaragua | 39 % |
| 121 | Mongolia | 39 % |
| 122 | Moldova | 39 % |
| 123 | Belarus | 39 % |
| 124 | Lithuania | 38 % |
| 125 | Georgia | 38 % |
| 126 | Switzerland its history → | 38 % |
| 127 | Eswatini | 37 % |
| 128 | Iran | 37 % |
| 129 | Kyrgyzstan | 37 % |
| 130 | Equatorial Guinea | 36 % |
| 131 | Oman | 36 % |
| 132 | Chad | 34 % |
| 133 | Djibouti | 33 % |
| 134 | Sweden its history → | 33 % |
| 135 | Uzbekistan | 33 % |
| 136 | Ethiopia | 32 % |
| 137 | United Arab Emirates | 32 % |
| 138 | Denmark | 32 % |
| 139 | Vietnam | 31 % |
| 140 | Peru | 31 % |
| 141 | Botswana | 31 % |
| 142 | Bosnia & Herzegovina | 30 % |
| 143 | Guatemala | 28 % |
| 144 | Taiwan | 27 % |
| 145 | Luxembourg | 26 % |
| 146 | Saudi Arabia | 26 % |
| 147 | Cambodia | 26 % |
| 148 | Tajikistan | 25 % |
| 149 | Kazakhstan | 24 % |
| 150 | Guyana | 24 % |
| 151 | Bulgaria | 24 % |
| 152 | Türkiye | 24 % |
| 153 | Estonia | 23 % |
| 154 | Congo - Kinshasa | 23 % |
| 155 | Solomon Islands | 22 % |
| 156 | Azerbaijan | 21 % |
| 157 | Russia | 20 % |
| 158 | Puerto Rico | 17 % |
| 159 | Haiti | 15 % |
| 160 | Timor-Leste | 14 % |
| 161 | Afghanistan | 9 % |
| 162 | Turkmenistan | 4 % |
| 163 | Kuwait | 3 % |
| 164 | Brunei | 2 % |
14 countries or territories have no value that year.
Continent averages
| World (GDP-weighted average) | 84 % |
| Europe (average) | 68 % |
| Africa (average) | 66 % |
| Americas (average) | 106 % |
| Asia (average) | 83 % |
| Oceania (average) | 50 % |
Understanding this map
What this figure measures
Public debt adds up government borrowing: government bonds, treasury bills, loans. It is compared with GDP to compare countries of different sizes and to set it against what the country can produce. A debt of 100% of GDP does not have to be repaid within a year: the state repays maturing loans by taking out new ones. What matters most is the cost of interest and lenders' confidence.
The great waves
Wars make debts explode: the United Kingdom reaches 260% of GDP after the Napoleonic wars (1819) and 270% in 1946, France 237% in 1921 according to the IMF (historians give between 150% and over 200%: GDP at the time is itself an estimate). After 1945, fast growth and inflation melt them away: under 30% in the UK by 1990. Since the 1980s they have risen again in rich countries, in steps at each crisis (2008, Covid in 2020).
The world curve
The 1946 peak (about 110% of GDP) is real: countries at war financed the military effort by borrowing, and the average is driven by the United States (nearly a third of the covered countries' GDP, debt of 121%) and the United Kingdom (270%). Then rapid post-war growth, inflation and low interest rates melt debts down to a trough in 1974 (about 30%). They rise again after the oil shocks: slower growth, unemployment, then very high interest rates in the 1980s. Note that this “world” is only the countries available: the USSR (1914 to 1991) and China (before 1984) are missing, and the curve breaks in 1939-1941, when too few countries are covered.
How can Japan owe 237% of its GDP?
The level alone does not say whether a debt is dangerous. Japan's is in yen and overwhelmingly held by residents, nearly half by the Bank of Japan itself: the country cannot run short of foreign currency to pay it. Conversely, a poor country borrowing in dollars from foreign creditors can default with a much smaller debt: Argentina in 2001 with less than 50% of GDP, Ecuador in 2008 with 25%. The interest rate, the currency of the debt and who holds it matter as much as its size.
Limits
This is gross debt: it does not subtract what the state owns. Norway's debt is about 40% of GDP, but it has a sovereign wealth fund worth more than three times its GDP. Depending on the country, figures cover all of government or only the central state, and older series are historians' reconstructions. Before 1950 few countries are covered: the world average is only shown in years when the available countries make up at least 60% of world GDP (from 1929), and likewise for each continent. For countries missing from the IMF historical database, the series starts in 1980 (World Economic Outlook).
Sources : FMI, Public Finances in Modern History (Mauro et al.) ; World Economic Outlook pour les pays absents
In the same theme : Public finances
All maps
Page updated on 2026-11-03.