Public spending on education
What government spends on education, from nursery school to university, as a share of the wealth produced (GDP).
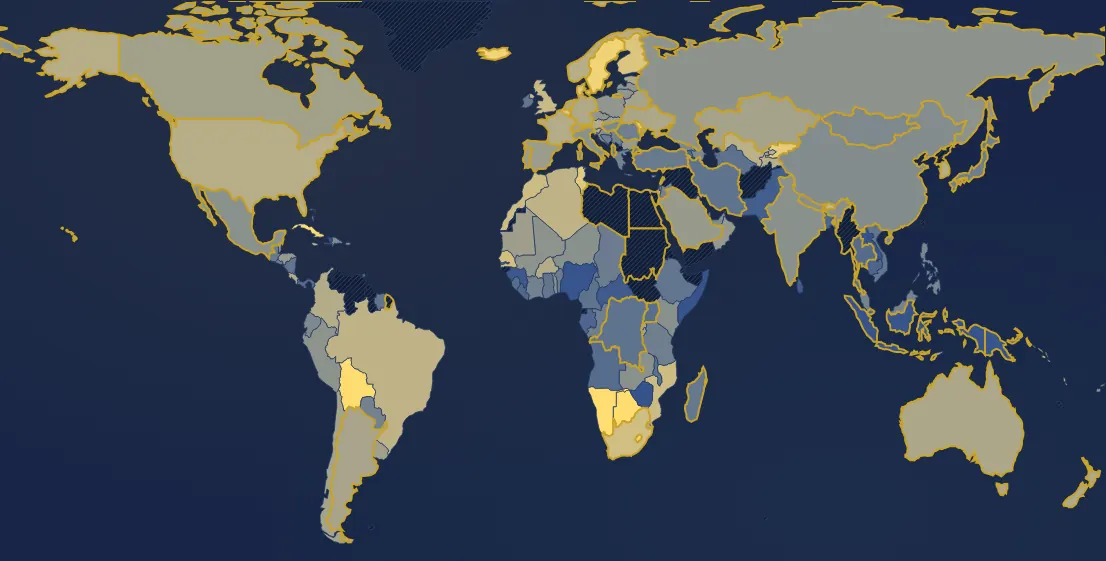
In 2023, 151 countries have a value. Highest: Namibia (9.4 %), Cuba (8.4 %), Solomon Islands (8.3 %). Lowest: Somalia (0 %), Nigeria (0.3 %), Zimbabwe (0.4 %). World (GDP-weighted average): 4.3 %. France: 5.3 % (36th of 151).
Country ranking in 2023
| Rank | Country | Value |
|---|---|---|
| 1 | Namibia | 9.4 % |
| 2 | Cuba | 8.4 % |
| 3 | Solomon Islands | 8.3 % |
| 4 | Botswana | 8.1 % |
| 5 | Bolivia | 7.9 % |
| 6 | Vanuatu | 7.6 % |
| 7 | Iceland | 7.3 % |
| 8 | Lesotho | 7.3 % |
| 9 | Sweden its history → | 7.3 % |
| 10 | Kyrgyzstan | 6.8 % |
| 11 | Tunisia | 6.7 % |
| 12 | Moldova | 6.6 % |
| 13 | Denmark | 6.4 % |
| 14 | Finland | 6.4 % |
| 15 | Belgium | 6.3 % |
| 16 | Senegal | 6.2 % |
| 17 | South Africa | 6.1 % |
| 18 | Morocco | 6 % |
| 19 | Mozambique | 6 % |
| 20 | United Kingdom | 5.9 % |
| 21 | Israel | 5.9 % |
| 22 | Bhutan | 5.8 % |
| 23 | Jamaica | 5.7 % |
| 24 | Brazil | 5.6 % |
| 25 | Algeria | 5.6 % |
| 26 | Uzbekistan | 5.5 % |
| 27 | South Korea | 5.4 % |
| 28 | Norway | 5.4 % |
| 29 | Palestine | 5.4 % |
| 30 | Tajikistan | 5.4 % |
| 31 | United States | 5.4 % |
| 32 | Austria | 5.3 % |
| 33 | Burkina Faso | 5.3 % |
| 34 | Colombia | 5.3 % |
| 35 | Costa Rica | 5.3 % |
| 36 | France its history → | 5.3 % |
| 37 | Slovenia | 5.3 % |
| 38 | Germany its history → | 5.2 % |
| 39 | Estonia | 5.2 % |
| 40 | Netherlands its history → | 5.2 % |
| 41 | New Zealand | 5.2 % |
| 42 | Timor-Leste | 5.2 % |
| 43 | Australia its history → | 5.1 % |
| 44 | Ukraine its history → | 5.1 % |
| 45 | Argentina its history → | 5 % |
| 46 | Kuwait | 5 % |
| 47 | Eswatini | 5 % |
| 48 | Burundi | 4.9 % |
| 49 | Belarus | 4.9 % |
| 50 | Switzerland its history → | 4.9 % |
| 51 | Chile | 4.9 % |
| 52 | Kazakhstan | 4.9 % |
| 53 | Rwanda | 4.9 % |
| 54 | Canada | 4.8 % |
| 55 | Uruguay | 4.8 % |
| 56 | Cyprus | 4.7 % |
| 57 | Malta | 4.7 % |
| 58 | Mauritania | 4.7 % |
| 59 | Slovakia | 4.7 % |
| 60 | Spain its history → | 4.6 % |
| 61 | Portugal its history → | 4.6 % |
| 62 | Bulgaria | 4.5 % |
| 63 | Honduras | 4.5 % |
| 64 | Saudi Arabia | 4.5 % |
| 65 | Oman | 4.4 % |
| 66 | Czechia | 4.3 % |
| 67 | Lithuania | 4.3 % |
| 68 | Latvia | 4.3 % |
| 69 | Poland | 4.3 % |
| 70 | Puerto Rico | 4.3 % |
| 71 | Belize | 4.2 % |
| 72 | Fiji | 4.2 % |
| 73 | Mali | 4.2 % |
| 74 | Peru | 4.2 % |
| 75 | Russia | 4.2 % |
| 76 | Croatia | 4.1 % |
| 77 | India its history → | 4.1 % |
| 78 | Italy | 4.1 % |
| 79 | Mexico | 4.1 % |
| 80 | Niger | 4.1 % |
| 81 | Togo | 4.1 % |
| 82 | Zambia | 4.1 % |
| 83 | Kenya | 4 % |
| 84 | Nepal | 4 % |
| 85 | United Arab Emirates | 3.9 % |
| 86 | China | 3.9 % |
| 87 | Dominican Republic | 3.8 % |
| 88 | Ecuador | 3.8 % |
| 89 | Hungary its history → | 3.8 % |
| 90 | Azerbaijan | 3.7 % |
| 91 | Georgia | 3.7 % |
| 92 | Luxembourg | 3.7 % |
| 93 | Mongolia | 3.7 % |
| 94 | Philippines | 3.6 % |
| 95 | Jordan | 3.5 % |
| 96 | Malaysia | 3.5 % |
| 97 | Côte d’Ivoire | 3.4 % |
| 98 | Greece | 3.4 % |
| 99 | Paraguay | 3.4 % |
| 100 | Serbia | 3.4 % |
| 101 | Congo - Brazzaville | 3.3 % |
| 102 | Japan | 3.3 % |
| 103 | Romania | 3.3 % |
| 104 | Tanzania | 3.3 % |
| 105 | Benin | 3.2 % |
| 106 | Bosnia & Herzegovina | 3.2 % |
| 107 | Qatar | 3.2 % |
| 108 | El Salvador | 3.2 % |
| 109 | Chad | 3.2 % |
| 110 | Trinidad & Tobago | 3.2 % |
| 111 | Albania | 3.1 % |
| 112 | Guatemala | 3.1 % |
| 113 | Türkiye | 3.1 % |
| 114 | Madagascar | 3 % |
| 115 | Ethiopia | 2.9 % |
| 116 | Ghana | 2.9 % |
| 117 | Ireland | 2.9 % |
| 118 | Nicaragua | 2.9 % |
| 119 | Suriname | 2.9 % |
| 120 | Vietnam | 2.9 % |
| 121 | Cameroon | 2.8 % |
| 122 | Congo - Kinshasa | 2.8 % |
| 123 | Gambia | 2.8 % |
| 124 | Iran | 2.8 % |
| 125 | Bahamas | 2.7 % |
| 126 | Malawi | 2.7 % |
| 127 | Turkmenistan | 2.7 % |
| 128 | Sierra Leone | 2.6 % |
| 129 | Uganda | 2.6 % |
| 130 | Angola | 2.5 % |
| 131 | Panama | 2.5 % |
| 132 | Thailand | 2.5 % |
| 133 | Armenia | 2.4 % |
| 134 | Gabon | 2.3 % |
| 135 | Liberia | 2.3 % |
| 136 | Bangladesh | 2.2 % |
| 137 | Cambodia | 2.2 % |
| 138 | Singapore | 2.1 % |
| 139 | Bermuda | 1.9 % |
| 140 | Pakistan | 1.9 % |
| 141 | Central African Republic | 1.8 % |
| 142 | Sri Lanka | 1.8 % |
| 143 | Guinea | 1.7 % |
| 144 | Lebanon | 1.5 % |
| 145 | Indonesia | 1.3 % |
| 146 | Laos | 1.2 % |
| 147 | Haiti | 1 % |
| 148 | Papua New Guinea | 0.8 % |
| 149 | Zimbabwe | 0.4 % |
| 150 | Nigeria | 0.3 % |
| 151 | Somalia | 0 % |
27 countries or territories have no value that year.
Continent averages
| World (GDP-weighted average) | 4.3 % |
| Europe (average) | 4.7 % |
| Africa (average) | 3.6 % |
| Americas (average) | 5.2 % |
| Asia (average) | 3.7 % |
| Oceania (average) | 5 % |
Understanding this map
What this figure measures
Teachers' pay, buildings, grants, school meals… paid from public funds. Fees paid by families (private schools, tuition) are not counted: a country with fee-paying universities, like the United States, therefore seems to spend less than it really does.
Spending that became massive
In 1870 European countries spent less than 1.5% of GDP on schools (France 0.3%, Germany 1.3%). With compulsory schooling, then longer studies after 1945, the share rises to 5-7% in rich countries: 5.3% in France in 2022, over 7% in Sweden. A high figure is not the whole story: a young country with many children must spend more to school everyone.
Missing data
Many countries do not publish this figure every year. When at most ten years (twenty for education) are missing between two known values, the map joins them with a straight line (the tooltip says “estimated”); after the last value it keeps it for up to three years (“latest data”). World and continents: GDP-weighted average, shown only when available countries make up at least 60% of the zone's GDP.
Sources : UNESCO, Banque mondiale et séries historiques (Tanzi et Schuknecht), via Our World in Data
In the same theme : Public finances
All maps
Page updated on 2026-11-03.