Military spending
What the country spends on its armed forces in a year (personnel, weapons, operations, military research), as a share of the wealth produced (GDP).
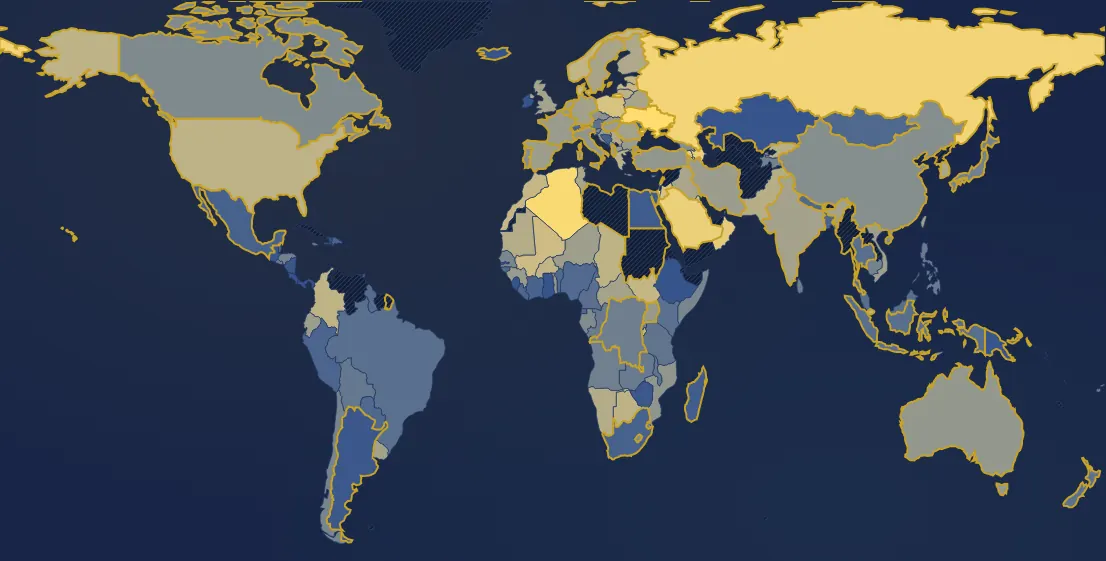
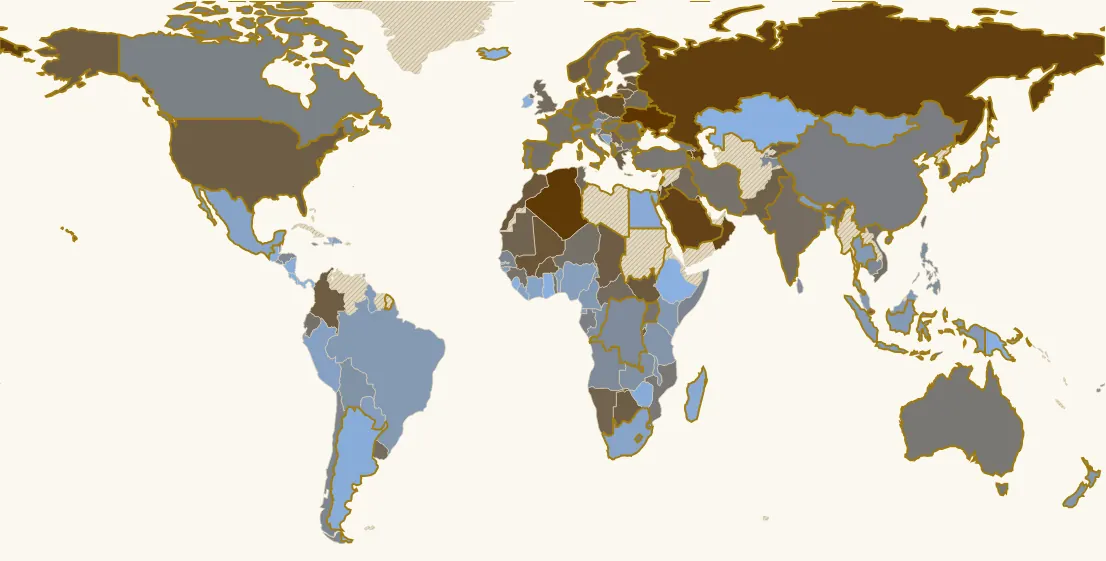
In 2025, 146 countries have a value. Highest: Ukraine (39.6 %), Algeria (8.8 %), Israel (7.8 %). Lowest: Panama (0 %), Iceland (0 %), Costa Rica (0 %). World (GDP-weighted average): 2.5 %. France: 2 % (56th of 146).
Country ranking in 2025
| Rank | Country | Value |
|---|---|---|
| 1 | Ukraine its history → | 39.6 % |
| 2 | Algeria | 8.8 % |
| 3 | Israel | 7.8 % |
| 4 | Russia | 7.5 % |
| 5 | Saudi Arabia | 6.5 % |
| 6 | Azerbaijan | 6.5 % |
| 7 | Armenia | 6.1 % |
| 8 | Oman | 5.7 % |
| 9 | Kuwait | 4.7 % |
| 10 | Jordan | 4.6 % |
| 11 | Poland | 4.5 % |
| 12 | Mali | 3.9 % |
| 13 | Latvia | 3.6 % |
| 14 | Morocco | 3.5 % |
| 15 | South Sudan | 3.4 % |
| 16 | Estonia | 3.4 % |
| 17 | Burkina Faso | 3.3 % |
| 18 | Norway | 3.3 % |
| 19 | Denmark | 3.3 % |
| 20 | Burundi | 3.2 % |
| 21 | Colombia | 3.2 % |
| 22 | Chad | 3.2 % |
| 23 | United States | 3.1 % |
| 24 | Botswana | 3.1 % |
| 25 | Lithuania | 3.1 % |
| 26 | Singapore | 3.1 % |
| 27 | Greece | 3 % |
| 28 | Kyrgyzstan | 2.9 % |
| 29 | Pakistan | 2.9 % |
| 30 | Namibia | 2.8 % |
| 31 | Serbia | 2.8 % |
| 32 | Mauritania | 2.8 % |
| 33 | South Korea | 2.6 % |
| 34 | Finland | 2.6 % |
| 35 | Lebanon | 2.5 % |
| 36 | Tunisia | 2.5 % |
| 37 | Sweden its history → | 2.5 % |
| 38 | Iraq | 2.5 % |
| 39 | Belarus | 2.4 % |
| 40 | United Kingdom | 2.4 % |
| 41 | Central African Republic | 2.3 % |
| 42 | India its history → | 2.3 % |
| 43 | Romania | 2.3 % |
| 44 | Uruguay | 2.3 % |
| 45 | Germany its history → | 2.3 % |
| 46 | Timor-Leste | 2.3 % |
| 47 | Netherlands its history → | 2.2 % |
| 48 | Vietnam | 2.2 % |
| 49 | Niger | 2.1 % |
| 50 | Spain its history → | 2.1 % |
| 51 | Ecuador | 2.1 % |
| 52 | Taiwan | 2.1 % |
| 53 | Iran | 2.1 % |
| 54 | Hungary its history → | 2 % |
| 55 | Albania | 2 % |
| 56 | France its history → | 2 % |
| 57 | Guinea | 2 % |
| 58 | Slovakia | 2 % |
| 59 | Croatia | 2 % |
| 60 | Belgium | 2 % |
| 61 | Bulgaria | 2 % |
| 62 | North Macedonia | 2 % |
| 63 | Uganda | 2 % |
| 64 | Australia its history → | 1.9 % |
| 65 | Türkiye | 1.9 % |
| 66 | Italy | 1.9 % |
| 67 | Montenegro | 1.9 % |
| 68 | Mozambique | 1.9 % |
| 69 | Togo | 1.9 % |
| 70 | Czechia | 1.8 % |
| 71 | Georgia | 1.8 % |
| 72 | China | 1.7 % |
| 73 | Portugal its history → | 1.7 % |
| 74 | Gabon | 1.7 % |
| 75 | Canada | 1.6 % |
| 76 | Lesotho | 1.6 % |
| 77 | Cyprus | 1.6 % |
| 78 | Eswatini | 1.6 % |
| 79 | Senegal | 1.6 % |
| 80 | Somalia | 1.5 % |
| 81 | Slovenia | 1.5 % |
| 82 | Chile | 1.5 % |
| 83 | Tajikistan | 1.5 % |
| 84 | Honduras | 1.5 % |
| 85 | Cambodia | 1.5 % |
| 86 | Japan | 1.4 % |
| 87 | Angola | 1.4 % |
| 88 | Congo - Kinshasa | 1.4 % |
| 89 | Jamaica | 1.4 % |
| 90 | El Salvador | 1.3 % |
| 91 | Fiji | 1.3 % |
| 92 | Congo - Brazzaville | 1.3 % |
| 93 | Sri Lanka | 1.3 % |
| 94 | Philippines | 1.3 % |
| 95 | Rwanda | 1.3 % |
| 96 | Zambia | 1.3 % |
| 97 | Bolivia | 1.2 % |
| 98 | Tanzania | 1.2 % |
| 99 | Malawi | 1.2 % |
| 100 | Austria | 1.1 % |
| 101 | New Zealand | 1.1 % |
| 102 | Kenya | 1.1 % |
| 103 | Cameroon | 1.1 % |
| 104 | Brazil | 1.1 % |
| 105 | Indonesia | 1 % |
| 106 | Malaysia | 1 % |
| 107 | Thailand | 1 % |
| 108 | Belize | 1 % |
| 109 | Guyana | 1 % |
| 110 | Nepal | 1 % |
| 111 | Trinidad & Tobago | 0.9 % |
| 112 | Nigeria | 0.9 % |
| 113 | Equatorial Guinea | 0.9 % |
| 114 | Benin | 0.9 % |
| 115 | Guinea-Bissau | 0.9 % |
| 116 | Mongolia | 0.9 % |
| 117 | Paraguay | 0.9 % |
| 118 | Liberia | 0.9 % |
| 119 | Luxembourg | 0.9 % |
| 120 | Bangladesh | 0.8 % |
| 121 | Peru | 0.8 % |
| 122 | Dominican Republic | 0.8 % |
| 123 | Côte d’Ivoire | 0.8 % |
| 124 | Switzerland its history → | 0.8 % |
| 125 | Mexico | 0.7 % |
| 126 | South Africa | 0.7 % |
| 127 | Bosnia & Herzegovina | 0.7 % |
| 128 | Madagascar | 0.6 % |
| 129 | Egypt | 0.6 % |
| 130 | Gambia | 0.6 % |
| 131 | Argentina its history → | 0.6 % |
| 132 | Moldova | 0.6 % |
| 133 | Nicaragua | 0.6 % |
| 134 | Zimbabwe | 0.6 % |
| 135 | Guatemala | 0.5 % |
| 136 | Ethiopia | 0.5 % |
| 137 | Ghana | 0.5 % |
| 138 | Malta | 0.5 % |
| 139 | Kazakhstan | 0.4 % |
| 140 | Sierra Leone | 0.4 % |
| 141 | Papua New Guinea | 0.4 % |
| 142 | Ireland | 0.2 % |
| 143 | Haiti | 0.1 % |
| 144 | Costa Rica | 0 % |
| 145 | Iceland | 0 % |
| 146 | Panama | 0 % |
32 countries or territories have no value that year.
Continent averages
| World (GDP-weighted average) | 2.5 % |
| Europe (average) | 3.6 % |
| Africa (average) | 1.8 % |
| Americas (average) | 2.4 % |
| Asia (average) | 2 % |
| Oceania (average) | 1.8 % |
Understanding this map
What this figure measures
The figures come from SIPRI, the Stockholm International Peace Research Institute. They include soldiers' pay and pensions, arms purchases, maintenance, operations and military research. The share of GDP shows the effort a country makes, not its power: the United States spends only about 3% of GDP on the military, yet that is 37% of world military spending in 2024 ($1 trillion), three times China. The “amount” button shows it. Amounts are converted at exchange rates: a soldier, a tank or an arms factory costs far less in China, Russia or India than in the United States, so these countries' real effort is understated.
Cold War, peace dividend, rearmament
Early in the Cold War the United States spent about 9% of GDP on the military (1960); Israel 23% in 1970, Saudi Arabia 17% in 1985. After the end of the USSR spending fell almost everywhere: the “peace dividend”. Since the invasion of Ukraine in 2022 it has been rising again: Ukraine spends nearly 40% of its GDP on the war in 2025, Russia 7.5%, and NATO members committed in 2025 to reach 5% of GDP by 2035 (3.5% for core defence).
Limits
Military budgets are often opaque. SIPRI publishes no figures for the USSR: Russia only appears in 1992, China in 1989, and North Korea never. Chinese and Russian figures are estimates, probably understated. The world average, GDP-weighted, only covers available countries: during the Cold War, without the Soviet bloc.
Sources : SIPRI Military Expenditure Database, via Our World in Data (CC BY 4.0)
In the same theme : Public finances
All maps
Page updated on 2026-11-03.