Median income per person per month
Half the population lives on less, half on more. After taxes and benefits, in dollars adjusted for the cost of living (2017).
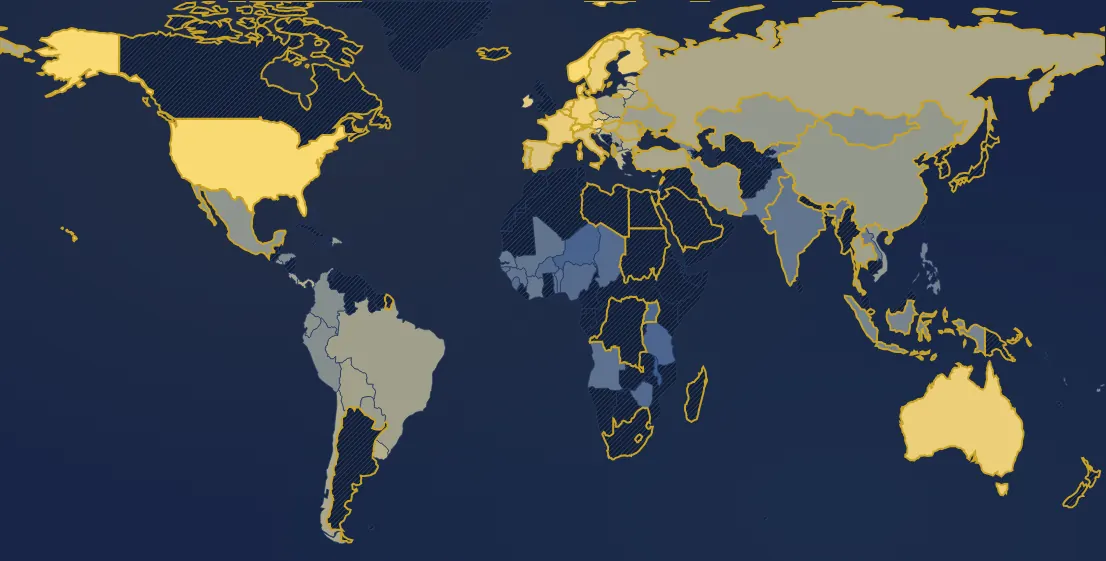
In 2021, 87 countries have a value. Highest: Luxembourg (2,110 $), Norway (1,990 $), United States (1,980 $). Lowest: Malawi (47 $), Niger (65 $), Tanzania (71 $). France: 1,510 $ (13th of 87).
Country ranking in 2021
| Rank | Country | Value |
|---|---|---|
| 1 | Luxembourg | 2,110 $ |
| 2 | Norway | 1,990 $ |
| 3 | United States | 1,980 $ |
| 4 | Switzerland its history → | 1,960 $ |
| 5 | Austria | 1,750 $ |
| 6 | Germany its history → | 1,670 $ |
| 7 | Netherlands its history → | 1,660 $ |
| 8 | Denmark | 1,640 $ |
| 9 | Australia its history → | 1,610 $ |
| 10 | Belgium | 1,600 $ |
| 11 | Finland | 1,560 $ |
| 12 | Sweden its history → | 1,540 $ |
| 13 | France its history → | 1,510 $ |
| 14 | Malta | 1,390 $ |
| 15 | Ireland | 1,360 $ |
| 16 | Cyprus | 1,310 $ |
| 17 | Italy | 1,240 $ |
| 18 | Spain its history → | 1,230 $ |
| 19 | Slovenia | 1,200 $ |
| 20 | Czechia | 1,050 $ |
| 21 | Estonia | 1,050 $ |
| 22 | Israel | 1,020 $ |
| 23 | Lithuania | 934 $ |
| 24 | Portugal its history → | 895 $ |
| 25 | Latvia | 819 $ |
| 26 | Croatia | 795 $ |
| 27 | Hungary its history → | 753 $ |
| 28 | Slovakia | 753 $ |
| 29 | Greece | 749 $ |
| 30 | Panama | 665 $ |
| 31 | Bulgaria | 635 $ |
| 32 | Uruguay | 620 $ |
| 33 | Romania | 579 $ |
| 34 | Russia | 529 $ |
| 35 | Belarus | 524 $ |
| 36 | Poland | 524 $ |
| 37 | Chile | 517 $ |
| 38 | Türkiye | 492 $ |
| 39 | Bolivia | 426 $ |
| 40 | Costa Rica | 423 $ |
| 41 | Brazil | 410 $ |
| 42 | Serbia | 402 $ |
| 43 | Albania | 398 $ |
| 44 | Thailand | 392 $ |
| 45 | Ukraine its history → | 383 $ |
| 46 | North Macedonia | 377 $ |
| 47 | Paraguay | 375 $ |
| 48 | Vietnam | 332 $ |
| 49 | China | 326 $ |
| 50 | Dominican Republic | 323 $ |
| 51 | Moldova | 320 $ |
| 52 | Kazakhstan | 317 $ |
| 53 | Iran | 314 $ |
| 54 | El Salvador | 301 $ |
| 55 | Mexico | 291 $ |
| 56 | Ecuador | 279 $ |
| 57 | Mongolia | 246 $ |
| 58 | Peru | 241 $ |
| 59 | Colombia | 237 $ |
| 60 | Honduras | 211 $ |
| 61 | Armenia | 202 $ |
| 62 | Fiji | 202 $ |
| 63 | Georgia | 183 $ |
| 64 | Indonesia | 175 $ |
| 65 | Kyrgyzstan | 165 $ |
| 66 | Philippines | 161 $ |
| 67 | Laos | 145 $ |
| 68 | Vanuatu | 142 $ |
| 69 | Senegal | 135 $ |
| 70 | Côte d’Ivoire | 132 $ |
| 71 | Pakistan | 124 $ |
| 72 | India its history → | 118 $ |
| 73 | Guinea | 116 $ |
| 74 | Mali | 115 $ |
| 75 | Benin | 106 $ |
| 76 | Angola | 104 $ |
| 77 | Guinea-Bissau | 101 $ |
| 78 | Togo | 98 $ |
| 79 | Burkina Faso | 91 $ |
| 80 | Sierra Leone | 90 $ |
| 81 | Nigeria | 90 $ |
| 82 | Chad | 88 $ |
| 83 | Zimbabwe | 81 $ |
| 84 | Uganda | 75 $ |
| 85 | Tanzania | 71 $ |
| 86 | Niger | 65 $ |
| 87 | Malawi | 47 $ |
91 countries or territories have no value that year.
Continent averages
| Europe (average) | 967 $ |
| Africa (average) | 90 $ |
| Americas (average) | 995 $ |
| Asia (average) | 221 $ |
| Oceania (average) | 1,550 $ |
Understanding this map
What this figure measures
Household surveys record what people earn (or, in many poorer countries, spend). Household income is split among its members, children and retirees included, then the person in the middle is taken: the median. It describes an ordinary person's situation better than the average, which a few very high incomes push up.
Why it is neither a wage nor GDP
It is not a wage: every resident is counted, not just those who work, so the amount is lower than a median wage. And it is not GDP: only income that actually reaches households is included. In 2018 France's GDP per person is over $4,000 a month, its median income about $1,500.
Limits
Surveys take place every 1 to 10 years depending on the country: between two surveys the value is interpolated, and the tooltip gives the latest one. Some countries measure consumption rather than income (India, China, Nigeria…), which is not quite comparable. Series stop around 2021 and often begin in the 1980s or 1990s.
Sources : Banque mondiale, Poverty and Inequality Platform, via Our World in Data (CC BY 4.0)
All maps
Page updated on 2026-11-03.