Interest paid on public debt
The interest government pays each year on its debt, as a share of the wealth the country produces (GDP). The tooltip also gives the average interest rate paid.
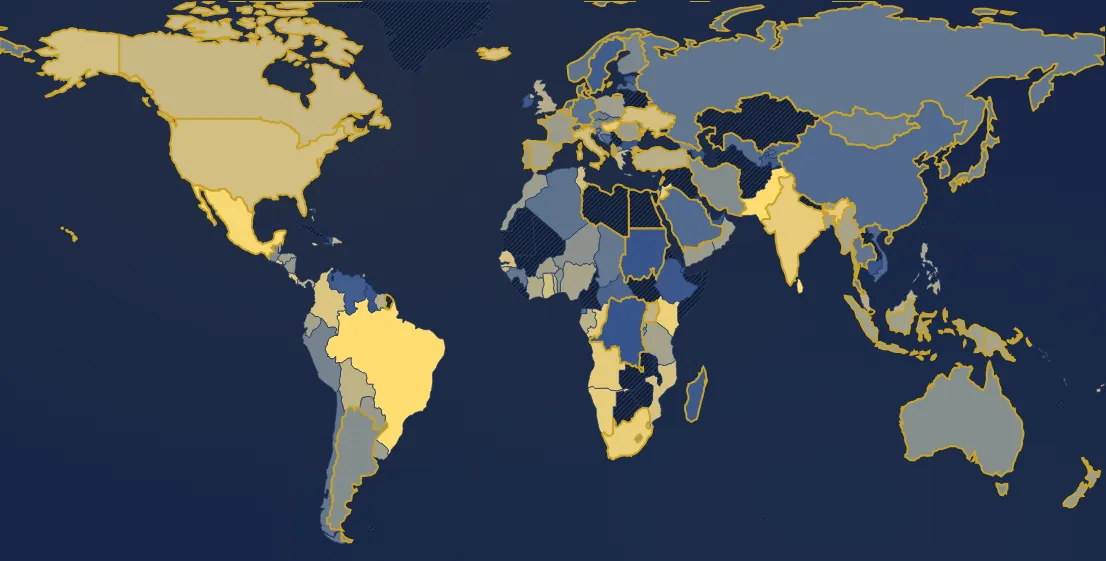
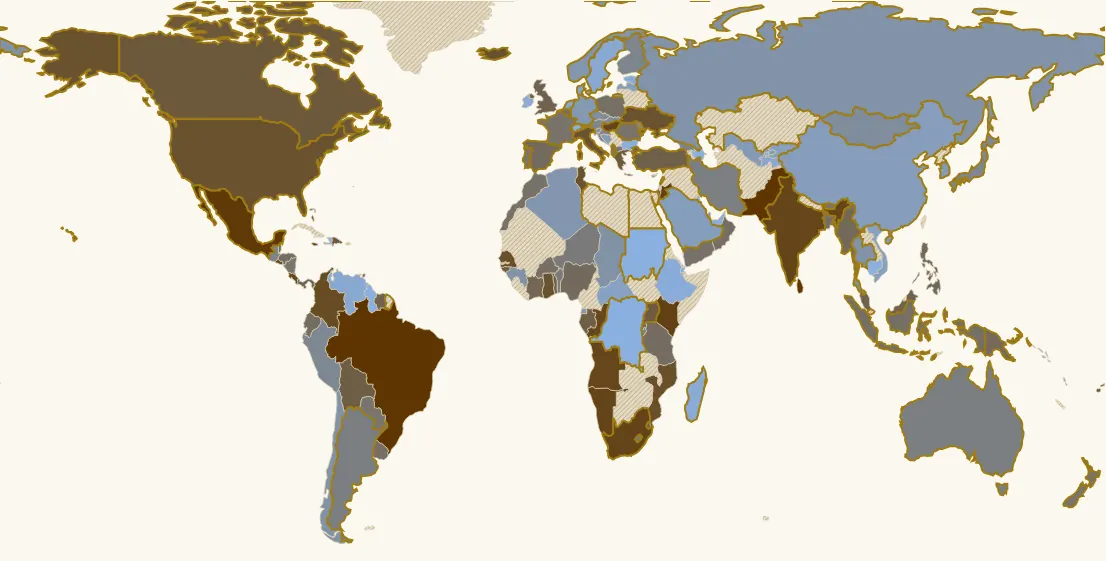
In 2024, 134 countries have a value. Highest: Brazil (8.3 %), Sri Lanka (7.8 %), Pakistan (7.8 %). Lowest: Kuwait (0.1 %), Sudan (0.1 %), Haiti (0.2 %). World (GDP-weighted average): 2.7 %. France: 2.1 % (64th of 134).
Country ranking in 2024
| Rank | Country | Value |
|---|---|---|
| 1 | Brazil | 8.3 % |
| 2 | Sri Lanka | 7.8 % |
| 3 | Pakistan | 7.8 % |
| 4 | Mexico | 6.5 % |
| 5 | Kenya | 5.7 % |
| 6 | Jordan | 5.5 % |
| 7 | South Africa | 5.3 % |
| 8 | Namibia | 5.2 % |
| 9 | Jamaica | 5.2 % |
| 10 | India its history → | 5.1 % |
| 11 | Hungary its history → | 5 % |
| 12 | Angola | 4.9 % |
| 13 | Costa Rica | 4.8 % |
| 14 | Congo - Brazzaville | 4.7 % |
| 15 | El Salvador | 4.6 % |
| 16 | Colombia | 4.4 % |
| 17 | Mozambique | 4.1 % |
| 18 | Senegal | 4.1 % |
| 19 | Iceland | 4.1 % |
| 20 | Tunisia | 4 % |
| 21 | Ghana | 4 % |
| 22 | Fiji | 4 % |
| 23 | Ukraine its history → | 4 % |
| 24 | United States | 4 % |
| 25 | Bahamas | 3.9 % |
| 26 | Italy | 3.9 % |
| 27 | Trinidad & Tobago | 3.8 % |
| 28 | Canada | 3.5 % |
| 29 | Greece | 3.5 % |
| 30 | Israel | 3.4 % |
| 31 | Dominican Republic | 3.4 % |
| 32 | Guinea-Bissau | 3.3 % |
| 33 | Uganda | 3.3 % |
| 34 | Bolivia | 3.1 % |
| 35 | Gabon | 3.1 % |
| 36 | Türkiye | 3 % |
| 37 | Togo | 3 % |
| 38 | Eswatini | 3 % |
| 39 | Panama | 2.9 % |
| 40 | United Kingdom | 2.8 % |
| 41 | Malaysia | 2.8 % |
| 42 | Suriname | 2.8 % |
| 43 | Côte d’Ivoire | 2.7 % |
| 44 | Philippines | 2.6 % |
| 45 | Belize | 2.5 % |
| 46 | Myanmar (Burma) | 2.5 % |
| 47 | Nigeria | 2.5 % |
| 48 | Spain its history → | 2.5 % |
| 49 | Papua New Guinea | 2.4 % |
| 50 | Rwanda | 2.4 % |
| 51 | Tanzania | 2.4 % |
| 52 | Ecuador | 2.3 % |
| 53 | Bangladesh | 2.3 % |
| 54 | Oman | 2.3 % |
| 55 | Honduras | 2.3 % |
| 56 | Belgium | 2.3 % |
| 57 | Uruguay | 2.3 % |
| 58 | Indonesia | 2.2 % |
| 59 | Burkina Faso | 2.2 % |
| 60 | Poland | 2.2 % |
| 61 | Albania | 2.2 % |
| 62 | Morocco | 2.1 % |
| 63 | Yemen | 2.1 % |
| 64 | France its history → | 2.1 % |
| 65 | Portugal its history → | 2.1 % |
| 66 | New Zealand | 2.1 % |
| 67 | Romania | 2.1 % |
| 68 | Paraguay | 2 % |
| 69 | Bhutan | 2 % |
| 70 | Nicaragua | 2 % |
| 71 | Lesotho | 1.9 % |
| 72 | North Macedonia | 1.9 % |
| 73 | Niger | 1.8 % |
| 74 | Benin | 1.8 % |
| 75 | Australia its history → | 1.7 % |
| 76 | Argentina its history → | 1.7 % |
| 77 | Iran | 1.7 % |
| 78 | Guatemala | 1.6 % |
| 79 | Georgia | 1.6 % |
| 80 | Burundi | 1.6 % |
| 81 | Finland | 1.6 % |
| 82 | Croatia | 1.5 % |
| 83 | Austria | 1.5 % |
| 84 | Peru | 1.5 % |
| 85 | Japan | 1.5 % |
| 86 | Slovakia | 1.4 % |
| 87 | Moldova | 1.4 % |
| 88 | Czechia | 1.3 % |
| 89 | Mongolia | 1.3 % |
| 90 | Qatar | 1.3 % |
| 91 | Slovenia | 1.3 % |
| 92 | Cyprus | 1.3 % |
| 93 | Chad | 1.2 % |
| 94 | Guinea | 1.2 % |
| 95 | Chile | 1.2 % |
| 96 | Thailand | 1.2 % |
| 97 | Russia | 1.2 % |
| 98 | Norway | 1.1 % |
| 99 | Algeria | 1.1 % |
| 100 | Equatorial Guinea | 1.1 % |
| 101 | Germany its history → | 1.1 % |
| 102 | South Korea | 1 % |
| 103 | Uzbekistan | 1 % |
| 104 | Bosnia & Herzegovina | 1 % |
| 105 | Saudi Arabia | 1 % |
| 106 | China | 1 % |
| 107 | Latvia | 0.9 % |
| 108 | Vietnam | 0.9 % |
| 109 | Kyrgyzstan | 0.9 % |
| 110 | Vanuatu | 0.9 % |
| 111 | Central African Republic | 0.9 % |
| 112 | Denmark | 0.8 % |
| 113 | Netherlands its history → | 0.7 % |
| 114 | Tajikistan | 0.7 % |
| 115 | Sweden its history → | 0.7 % |
| 116 | Venezuela | 0.7 % |
| 117 | Madagascar | 0.6 % |
| 118 | Ireland | 0.6 % |
| 119 | Lebanon | 0.6 % |
| 120 | Ethiopia | 0.6 % |
| 121 | Estonia | 0.6 % |
| 122 | United Arab Emirates | 0.6 % |
| 123 | Bulgaria | 0.5 % |
| 124 | Congo - Kinshasa | 0.5 % |
| 125 | Solomon Islands | 0.5 % |
| 126 | Switzerland its history → | 0.4 % |
| 127 | Azerbaijan | 0.4 % |
| 128 | Luxembourg | 0.3 % |
| 129 | Guyana | 0.3 % |
| 130 | Cambodia | 0.3 % |
| 131 | Djibouti | 0.2 % |
| 132 | Haiti | 0.2 % |
| 133 | Sudan | 0.1 % |
| 134 | Kuwait | 0.1 % |
44 countries or territories have no value that year.
Continent averages
| World (GDP-weighted average) | 2.7 % |
| Europe (average) | 2 % |
| Africa (average) | 2.9 % |
| Americas (average) | 4.3 % |
| Asia (average) | 2.1 % |
| Oceania (average) | 1.8 % |
Understanding this map
What debt costs
A state almost never repays its debt: it borrows again to repay loans as they fall due. What it really pays each year is interest, and that is what weighs on the budget. It depends on two things: the size of the debt and the rate at which the country borrowed.
The rate matters as much as the amount
In France, debt rose from about 35% of GDP in 1990 to 113% in 2024, yet interest weighed more in 1996 (3.6% of GDP) than in 2024 (2.1%): the average rate paid fell from about 8% to 2%. Italy paid up to 11.5% of GDP in interest in 1996. Japan, with debt of 237%, pays only about 1.5% of GDP thanks to near-zero rates. Since 2022, rising rates have pushed the burden up again: in the French state budget, interest has become one of the very largest spending items, on a par with schools.
The average rate paid
The tooltip computes it by dividing the year's interest by the previous year's debt. It is an average over all accumulated debt, not the rate at which the country borrows today (the “10-year rate” in the news): when market rates rise, only renewed debt becomes more expensive, so the burden reacts with a lag of several years. And a high rate weighs less when inflation is high too, as in Brazil.
Limits
Before 1950 few countries are covered, and the world average only appears from 1929 (covered countries ≥ 60% of world GDP). Depending on the country, the figure covers general government or the central state. The average rate is approximate when debt changes a lot from one year to the next.
Sources : FMI, Public Finances in Modern History (Mauro et al.) ; World Economic Outlook pour les pays absents
In the same theme : Public finances
All maps
Page updated on 2026-11-03.