Tax revenue
All taxes and social contributions collected during the year, as a share of the wealth the country produces (GDP).
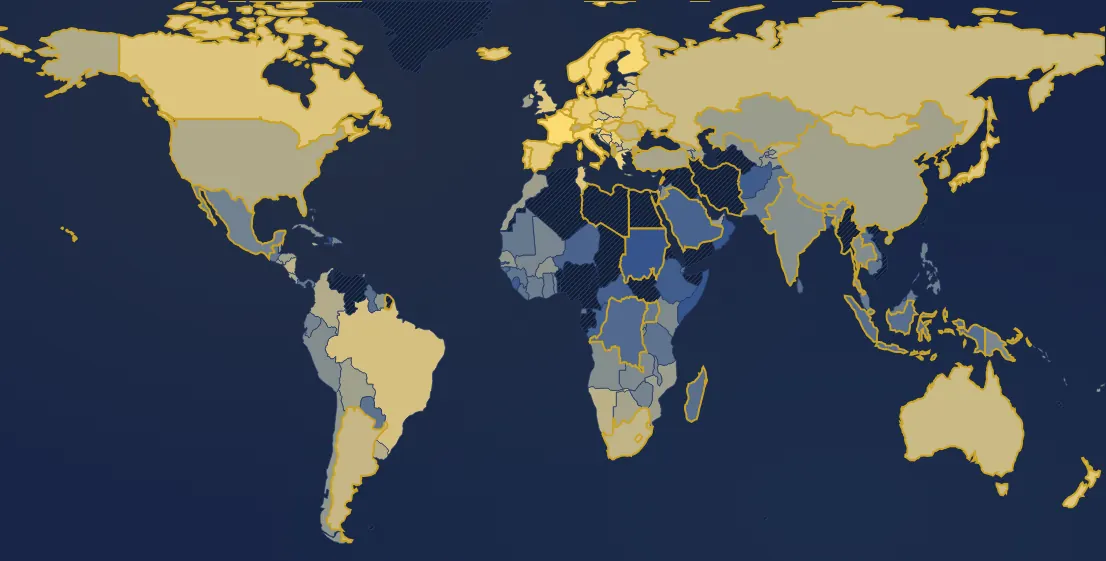
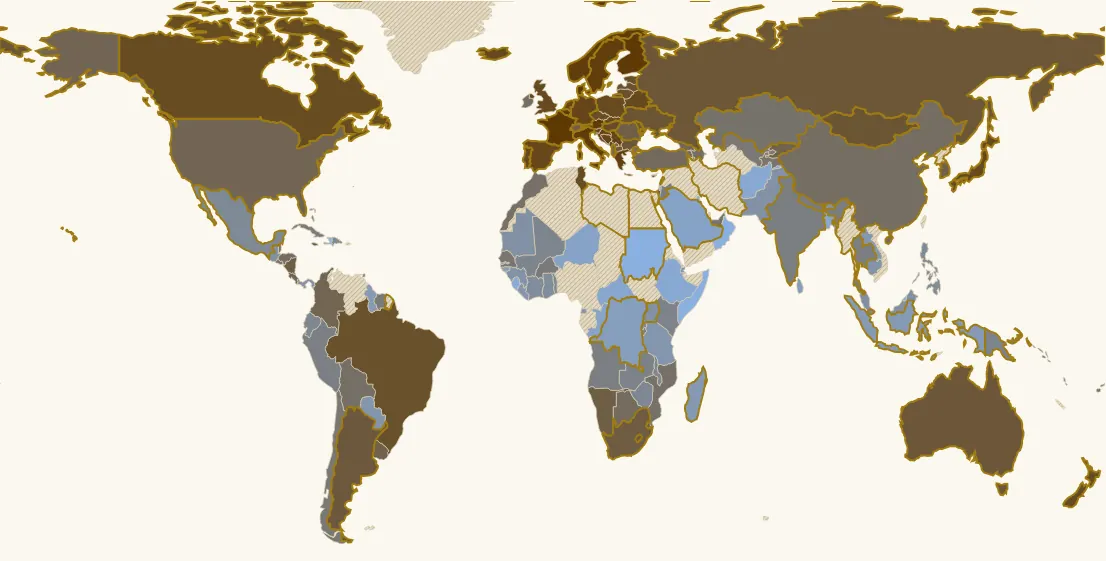
In 2023, 147 countries have a value. Highest: France (43.8 %), Denmark (43.4 %), Finland (42.7 %). Lowest: Kuwait (1.2 %), Somalia (2.1 %), Sudan (3.1 %). World (GDP-weighted average): 25.2 %. France: 43.8 % (1st of 147).
Country ranking in 2023
| Rank | Country | Value |
|---|---|---|
| 1 | France its history → | 43.8 % |
| 2 | Denmark | 43.4 % |
| 3 | Finland | 42.7 % |
| 4 | Belgium | 42.6 % |
| 5 | Austria | 42.5 % |
| 6 | Italy | 42 % |
| 7 | Norway | 41.4 % |
| 8 | Sweden its history → | 41.4 % |
| 9 | Luxembourg | 40.9 % |
| 10 | Greece | 39.8 % |
| 11 | Netherlands its history → | 38.5 % |
| 12 | Serbia | 38.4 % |
| 13 | Croatia | 38 % |
| 14 | Germany its history → | 37.5 % |
| 15 | Bosnia & Herzegovina | 37.1 % |
| 16 | Montenegro | 36.8 % |
| 17 | Spain its history → | 36.4 % |
| 18 | Slovenia | 36.4 % |
| 19 | Portugal its history → | 35.8 % |
| 20 | Iceland | 35.6 % |
| 21 | Slovakia | 35.5 % |
| 22 | Belarus | 35.3 % |
| 23 | Poland | 35.1 % |
| 24 | United Kingdom | 34.9 % |
| 25 | Japan | 34.9 % |
| 26 | Canada | 34.8 % |
| 27 | Tunisia | 34.8 % |
| 28 | New Zealand | 34.7 % |
| 29 | Hungary its history → | 34.2 % |
| 30 | Czechia | 33.7 % |
| 31 | Estonia | 33.5 % |
| 32 | Brazil | 32.7 % |
| 33 | Lithuania | 32.6 % |
| 34 | Latvia | 31.9 % |
| 35 | Ukraine its history → | 31.4 % |
| 36 | Mongolia | 31.3 % |
| 37 | Moldova | 30.6 % |
| 38 | Russia | 30.5 % |
| 39 | Australia its history → | 30.4 % |
| 40 | Lesotho | 30.4 % |
| 41 | Bulgaria | 30 % |
| 42 | Israel | 29.8 % |
| 43 | Argentina its history → | 29.6 % |
| 44 | North Macedonia | 29.5 % |
| 45 | Cyprus | 28.2 % |
| 46 | South Africa | 28.1 % |
| 47 | Jamaica | 27.8 % |
| 48 | Nicaragua | 27.8 % |
| 49 | Eswatini | 27.7 % |
| 50 | Romania | 27.5 % |
| 51 | Namibia | 27 % |
| 52 | South Korea | 26.9 % |
| 53 | Switzerland its history → | 26.8 % |
| 54 | Kosovo | 25.9 % |
| 55 | Kyrgyzstan | 25.9 % |
| 56 | Uruguay | 25.9 % |
| 57 | Albania | 25.5 % |
| 58 | Colombia | 25.2 % |
| 59 | Costa Rica | 24.9 % |
| 60 | United States | 24.8 % |
| 61 | Georgia | 24.6 % |
| 62 | Türkiye | 23.2 % |
| 63 | Armenia | 23 % |
| 64 | Botswana | 22.8 % |
| 65 | Azerbaijan | 22.5 % |
| 66 | China | 22.1 % |
| 67 | Ireland | 21.9 % |
| 68 | Belize | 21.7 % |
| 69 | Honduras | 21.6 % |
| 70 | Solomon Islands | 21.6 % |
| 71 | Bolivia | 21.5 % |
| 72 | Morocco | 21 % |
| 73 | Mozambique | 20.9 % |
| 74 | Fiji | 20.7 % |
| 75 | El Salvador | 20.6 % |
| 76 | Kazakhstan | 20.5 % |
| 77 | United Arab Emirates | 20 % |
| 78 | Trinidad & Tobago | 19.9 % |
| 79 | Tajikistan | 19.7 % |
| 80 | Senegal | 19.4 % |
| 81 | Chile | 18.9 % |
| 82 | Uzbekistan | 18.8 % |
| 83 | Suriname | 18.6 % |
| 84 | Burkina Faso | 18.4 % |
| 85 | Vanuatu | 18.1 % |
| 86 | Cuba | 17.7 % |
| 87 | Nepal | 17.7 % |
| 88 | Bahamas | 17.3 % |
| 89 | India its history → | 17.3 % |
| 90 | Angola | 17.2 % |
| 91 | Jordan | 17.2 % |
| 92 | Thailand | 17 % |
| 93 | Peru | 16.9 % |
| 94 | Zambia | 16.2 % |
| 95 | Burundi | 16.1 % |
| 96 | Kenya | 16.1 % |
| 97 | Papua New Guinea | 15.8 % |
| 98 | Mali | 15.5 % |
| 99 | Ecuador | 15.1 % |
| 100 | Malawi | 15.1 % |
| 101 | Togo | 14.9 % |
| 102 | Zimbabwe | 14.9 % |
| 103 | Dominican Republic | 14.3 % |
| 104 | Mexico | 14.3 % |
| 105 | Philippines | 14.1 % |
| 106 | Rwanda | 14 % |
| 107 | Singapore | 14 % |
| 108 | Côte d’Ivoire | 13.6 % |
| 109 | Ghana | 13.5 % |
| 110 | Mauritania | 12.6 % |
| 111 | Malaysia | 12.6 % |
| 112 | Panama | 12.5 % |
| 113 | Uganda | 12.5 % |
| 114 | Bhutan | 12.4 % |
| 115 | Pakistan | 12.4 % |
| 116 | Guatemala | 12.3 % |
| 117 | Cambodia | 12 % |
| 118 | Guinea | 11.9 % |
| 119 | Liberia | 11.5 % |
| 120 | Tanzania | 11.5 % |
| 121 | Djibouti | 11.3 % |
| 122 | Equatorial Guinea | 11.3 % |
| 123 | Paraguay | 11.3 % |
| 124 | Laos | 10.6 % |
| 125 | Madagascar | 10.4 % |
| 126 | Guyana | 10.3 % |
| 127 | Indonesia | 10.3 % |
| 128 | Sri Lanka | 9.8 % |
| 129 | Gambia | 9.5 % |
| 130 | Congo - Kinshasa | 9.3 % |
| 131 | Guinea-Bissau | 9.2 % |
| 132 | Niger | 8.1 % |
| 133 | Saudi Arabia | 8 % |
| 134 | Congo - Brazzaville | 7.8 % |
| 135 | Bangladesh | 7.3 % |
| 136 | Central African Republic | 7.2 % |
| 137 | Afghanistan | 6.8 % |
| 138 | Ethiopia | 6.8 % |
| 139 | Palestine | 6.6 % |
| 140 | Sierra Leone | 6.3 % |
| 141 | Lebanon | 5.8 % |
| 142 | Brunei | 5.6 % |
| 143 | Oman | 4.4 % |
| 144 | Haiti | 4 % |
| 145 | Sudan | 3.1 % |
| 146 | Somalia | 2.1 % |
| 147 | Kuwait | 1.2 % |
31 countries or territories have no value that year.
Continent averages
| World (GDP-weighted average) | 25.2 % |
| Europe (average) | 35.3 % |
| Africa (average) | 17.4 % |
| Americas (average) | 25 % |
| Asia (average) | 20.2 % |
| Oceania (average) | 30.6 % |
Understanding this map
What this figure measures
It adds up everything general government collects: taxes on income and profits, VAT and other consumption taxes, property taxes, and social contributions (pensions, unemployment, health). As a share of GDP it measures the weight of taxation in the economy, which lets countries of very different sizes be compared.
Why social contributions are included
Countries fund social protection in different ways: Denmark almost entirely through taxes, France mostly through contributions on wages. Without contributions France would look far less taxed than Denmark, whereas both collect about 43-44% of GDP in total.
What the figure does not say
A low rate does not mean residents pay less for the same services: in Switzerland and the United States, health insurance is private (compulsory in Switzerland) and so does not appear here. Nor does the figure say who pays (progressivity), what the state gives back in services, or what tax rate an employee faces. Gulf oil states fund the state from oil rents, not taxes: their very low rate (1% in Kuwait) does not mean a light state. Finally, the denominator matters: Ireland looks lightly taxed because its GDP is inflated by the profits of multinationals domiciled there.
Taxes on income and profits
The “on income and profits” button keeps only personal income tax and corporate profit tax, combined in a single series: the source does not publish personal income tax alone for every country. Differences mostly reflect how social protection is funded: Denmark (29% of GDP) pays for it through income tax, France (12%) mainly through contributions, counted separately. This is the series to set against the top marginal rate when looking for a Laffer effect (the “A Laffer curve?” example in Correlations).
Limits
Series start in 1980, after the great 20th-century rise in taxation (in rich countries, from about 10% of GDP before 1914 to 30-45% after 1945). Observations the source considers unreliable are excluded, and oil and mining revenues are poorly separated. Some countries publish late: for up to three years the map carries the last known value, and the tooltip says so. World and continent averages are GDP-weighted and cover the countries available each year.
Sources : UNU-WIDER, Government Revenue Dataset (2025), via Our World in Data (CC BY 4.0)
In the same theme : Public finances
All maps
Page updated on 2026-11-03.