Children dying before age 5
Share of children born alive who die before their fifth birthday.
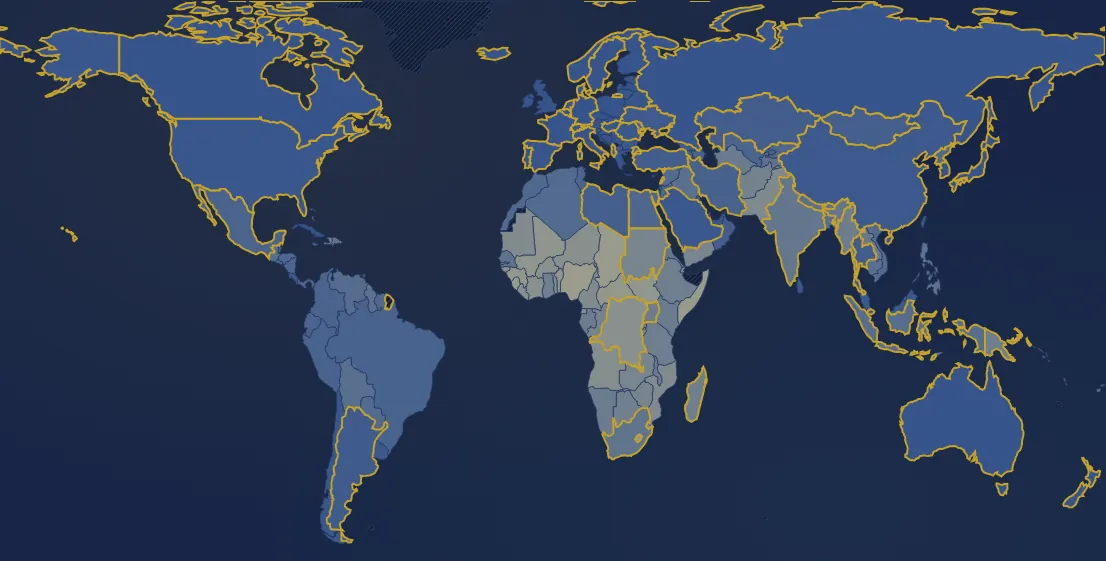
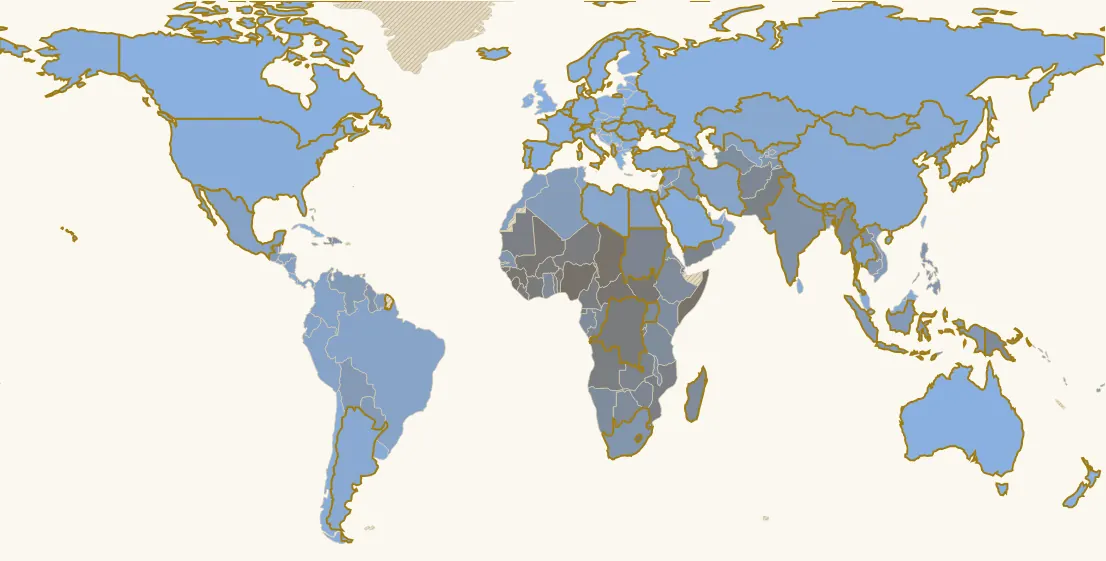
In 2024, 169 countries have a value. Highest: Nigeria (107 %), Sierra Leone (103 %), Somalia (103 %). Lowest: Slovenia (1.5 %), Finland (1.8 %), Norway (1.9 %). World (population-weighted average): 24 %. France: 3.7 % (136th of 169).
Country ranking in 2024
| Rank | Country | Value |
|---|---|---|
| 1 | Nigeria | 107 % |
| 2 | Sierra Leone | 103 % |
| 3 | Somalia | 103 % |
| 4 | Chad | 102 % |
| 5 | Central African Republic | 93 % |
| 6 | Guinea | 91 % |
| 7 | South Sudan | 87 % |
| 8 | Mali | 86 % |
| 9 | Lesotho | 84 % |
| 10 | Benin | 82 % |
| 11 | Burkina Faso | 77 % |
| 12 | Côte d’Ivoire | 75 % |
| 13 | Congo - Kinshasa | 74 % |
| 14 | Guinea-Bissau | 73 % |
| 15 | Liberia | 72 % |
| 16 | Equatorial Guinea | 71 % |
| 17 | Niger | 71 % |
| 18 | Angola | 68 % |
| 19 | Cameroon | 65 % |
| 20 | Mauritania | 64 % |
| 21 | Mozambique | 64 % |
| 22 | Pakistan | 61 % |
| 23 | Togo | 60 % |
| 24 | Zambia | 54 % |
| 25 | Yemen | 54 % |
| 26 | Sudan | 53 % |
| 27 | Burundi | 52 % |
| 28 | Haiti | 52 % |
| 29 | Zimbabwe | 51 % |
| 30 | Congo - Brazzaville | 50 % |
| 31 | Djibouti | 49 % |
| 32 | Afghanistan | 48 % |
| 33 | Eswatini | 44 % |
| 34 | Ghana | 43 % |
| 35 | Gambia | 42 % |
| 36 | Botswana | 42 % |
| 37 | Madagascar | 42 % |
| 38 | Papua New Guinea | 41 % |
| 39 | Ethiopia | 41 % |
| 40 | Tanzania | 40 % |
| 41 | Uganda | 40 % |
| 42 | Myanmar (Burma) | 40 % |
| 43 | Gabon | 39 % |
| 44 | Namibia | 38 % |
| 45 | Turkmenistan | 37 % |
| 46 | Rwanda | 36 % |
| 47 | Kenya | 36 % |
| 48 | Malawi | 36 % |
| 49 | Laos | 35 % |
| 50 | Timor-Leste | 35 % |
| 51 | Eritrea | 33 % |
| 52 | India its history → | 29 % |
| 53 | Dominican Republic | 28 % |
| 54 | South Africa | 27 % |
| 55 | Senegal | 27 % |
| 56 | Tajikistan | 26 % |
| 57 | Guyana | 25 % |
| 58 | Philippines | 25 % |
| 59 | Iraq | 23 % |
| 60 | Bangladesh | 23 % |
| 61 | Bhutan | 23 % |
| 62 | Cambodia | 22 % |
| 63 | Bolivia | 22 % |
| 64 | Nepal | 22 % |
| 65 | Guatemala | 21 % |
| 66 | Vanuatu | 21 % |
| 67 | Indonesia | 21 % |
| 68 | Fiji | 21 % |
| 69 | Venezuela | 20 % |
| 70 | Syria | 19 % |
| 71 | Paraguay | 19 % |
| 72 | Algeria | 18 % |
| 73 | Vietnam | 18 % |
| 74 | Solomon Islands | 18 % |
| 75 | North Korea | 16 % |
| 76 | Suriname | 16 % |
| 77 | Trinidad & Tobago | 16 % |
| 78 | Morocco | 16 % |
| 79 | Egypt | 15 % |
| 80 | Honduras | 15 % |
| 81 | Kyrgyzstan | 15 % |
| 82 | Palestine | 14 % |
| 83 | Nicaragua | 14 % |
| 84 | Tunisia | 14 % |
| 85 | Panama | 14 % |
| 86 | Uzbekistan | 13 % |
| 87 | Jordan | 13 % |
| 88 | Jamaica | 12 % |
| 89 | Mexico | 12 % |
| 90 | Ecuador | 12 % |
| 91 | Colombia | 12 % |
| 92 | Brunei | 12 % |
| 93 | Azerbaijan | 11 % |
| 94 | Brazil | 11 % |
| 95 | Peru | 11 % |
| 96 | El Salvador | 11 % |
| 97 | Belize | 11 % |
| 98 | Bahamas | 11 % |
| 99 | Iran | 11 % |
| 100 | Moldova | 11 % |
| 101 | Armenia | 10 % |
| 102 | Libya | 9.6 % |
| 103 | Mongolia | 9.3 % |
| 104 | Oman | 9.1 % |
| 105 | Kazakhstan | 8.5 % |
| 106 | Türkiye | 8.4 % |
| 107 | Georgia | 7.9 % |
| 108 | Thailand | 7.9 % |
| 109 | Argentina its history → | 7.5 % |
| 110 | Albania | 7.5 % |
| 111 | Kuwait | 7.2 % |
| 112 | Ukraine its history → | 7.2 % |
| 113 | Costa Rica | 7.1 % |
| 114 | North Macedonia | 6.8 % |
| 115 | Uruguay | 6.7 % |
| 116 | China | 6.7 % |
| 117 | Malaysia | 6.5 % |
| 118 | Lebanon | 6.4 % |
| 119 | Romania | 6.1 % |
| 120 | Sri Lanka | 6 % |
| 121 | Saudi Arabia | 6 % |
| 122 | Chile | 5.8 % |
| 123 | Bulgaria | 5.7 % |
| 124 | United States | 5.7 % |
| 125 | United Arab Emirates | 5.6 % |
| 126 | Qatar | 5.4 % |
| 127 | Malta | 5.1 % |
| 128 | Bosnia & Herzegovina | 4.9 % |
| 129 | Cuba | 4.8 % |
| 130 | Slovakia | 4.6 % |
| 131 | Russia | 4.6 % |
| 132 | Serbia | 4.6 % |
| 133 | New Zealand | 4.4 % |
| 134 | Canada | 4.4 % |
| 135 | Poland | 3.8 % |
| 136 | France its history → | 3.7 % |
| 137 | Croatia | 3.7 % |
| 138 | Taiwan | 3.7 % |
| 139 | Switzerland its history → | 3.6 % |
| 140 | United Kingdom | 3.6 % |
| 141 | Latvia | 3.6 % |
| 142 | Denmark | 3.5 % |
| 143 | Australia its history → | 3.4 % |
| 144 | Greece | 3.3 % |
| 145 | Hungary its history → | 3.3 % |
| 146 | Belgium | 3.3 % |
| 147 | Netherlands its history → | 3.2 % |
| 148 | Israel | 3.1 % |
| 149 | Germany its history → | 3 % |
| 150 | Lithuania | 2.9 % |
| 151 | Belarus | 2.8 % |
| 152 | Ireland | 2.8 % |
| 153 | Austria | 2.7 % |
| 154 | South Korea | 2.7 % |
| 155 | Spain its history → | 2.6 % |
| 156 | Czechia | 2.6 % |
| 157 | Portugal its history → | 2.6 % |
| 158 | Italy | 2.5 % |
| 159 | Cyprus | 2.4 % |
| 160 | Montenegro | 2.4 % |
| 161 | Estonia | 2.3 % |
| 162 | Sweden its history → | 2.2 % |
| 163 | Japan | 2.2 % |
| 164 | Singapore | 2.1 % |
| 165 | Iceland | 2 % |
| 166 | Luxembourg | 1.9 % |
| 167 | Norway | 1.9 % |
| 168 | Finland | 1.8 % |
| 169 | Slovenia | 1.5 % |
9 countries or territories have no value that year.
Continent averages
| World (population-weighted average) | 24 % |
| Europe (average) | 4.4 % |
| Africa (average) | 58 % |
| Americas (average) | 10 % |
| Asia (average) | 21 % |
| Oceania (average) | 13 % |
Understanding this map
Definition
Out of 100 children born alive in a given year, how many die before age 5 under that year's conditions. Demographers call it “under-5 mortality”; “infant mortality” in the strict sense only counts the first year.
Orders of magnitude
Around 1800 more than one child in three died everywhere in the world, in today's rich countries as elsewhere. France fell below 10% in the 1930s and below 1% in the 1990s. The main causes: infectious disease, diarrhoea, malnutrition.
Limits
Before universal civil registration, these are reconstructions from parish registers, censuses and surveys, with wide margins of error.
Sources : Gapminder (CC BY 4.0), d’après ONU, HMD, Maddison et autres
All maps
Page updated on 2026-11-03.