Economic freedom index
A 0-to-10 score computed by the Fraser Institute: the higher it is, the freer trade, prices and property are from state intervention, and the better the law protects them.
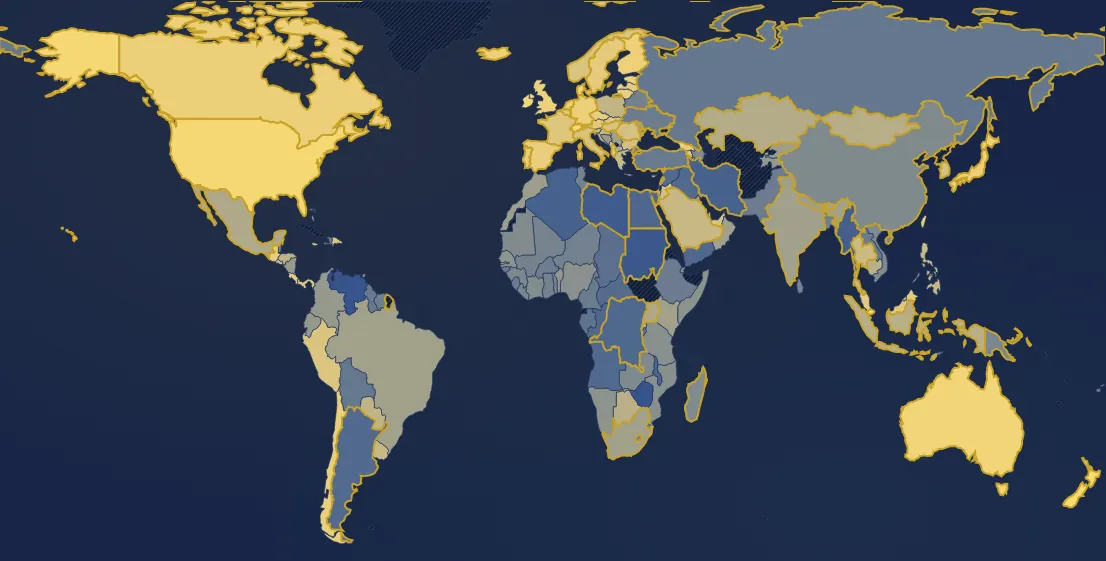
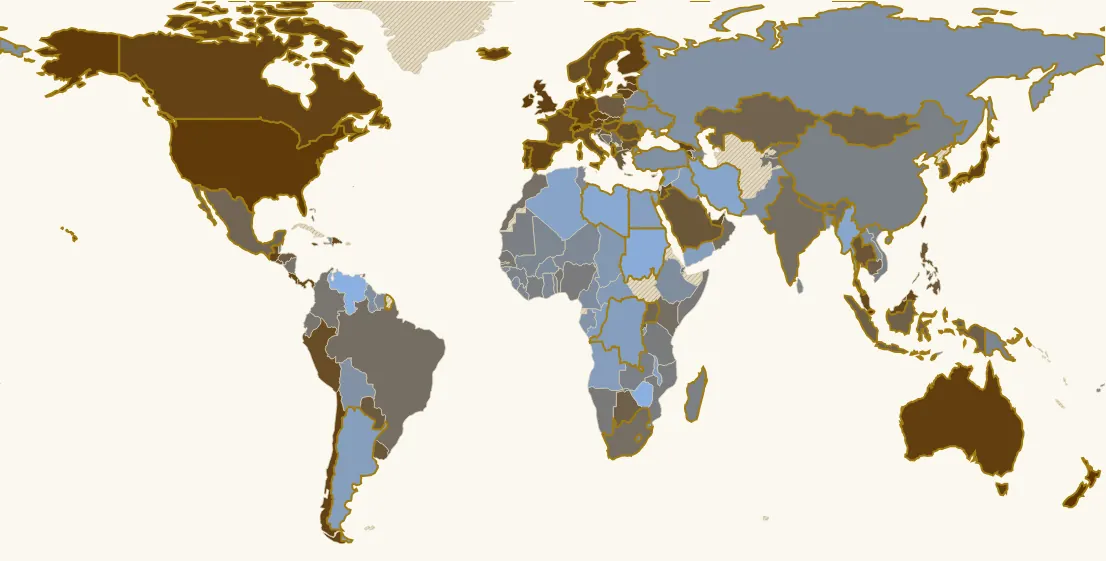
In 2024, 158 countries have a value. Highest: Switzerland (8.46 / 10), Singapore (8.44 / 10), New Zealand (8.39 / 10). Lowest: Venezuela (2.95 / 10), Zimbabwe (3.63 / 10), Sudan (4.17 / 10). World (population-weighted average): 6.43 / 10. France: 7.52 / 10 (36th of 158).
Country ranking in 2024
| Rank | Country | Value |
|---|---|---|
| 1 | Switzerland its history → | 8.46 / 10 |
| 2 | Singapore | 8.44 / 10 |
| 3 | New Zealand | 8.39 / 10 |
| 4 | United States | 8.22 / 10 |
| 5 | Ireland | 8.17 / 10 |
| 6 | Denmark | 8.14 / 10 |
| 7 | Australia its history → | 8.07 / 10 |
| 8 | Finland | 7.97 / 10 |
| 9 | United Kingdom | 7.97 / 10 |
| 10 | Netherlands its history → | 7.97 / 10 |
| 11 | Iceland | 7.96 / 10 |
| 12 | Japan | 7.96 / 10 |
| 13 | Estonia | 7.93 / 10 |
| 14 | Luxembourg | 7.93 / 10 |
| 15 | Taiwan | 7.91 / 10 |
| 16 | Canada | 7.9 / 10 |
| 17 | Germany its history → | 7.89 / 10 |
| 18 | Chile | 7.86 / 10 |
| 19 | Malta | 7.86 / 10 |
| 20 | Lithuania | 7.83 / 10 |
| 21 | Czechia | 7.82 / 10 |
| 22 | Cyprus | 7.79 / 10 |
| 23 | Spain its history → | 7.79 / 10 |
| 24 | Georgia | 7.77 / 10 |
| 25 | Guatemala | 7.77 / 10 |
| 26 | Costa Rica | 7.76 / 10 |
| 27 | Latvia | 7.75 / 10 |
| 28 | Portugal its history → | 7.73 / 10 |
| 29 | Albania | 7.68 / 10 |
| 30 | Austria | 7.68 / 10 |
| 31 | Sweden its history → | 7.67 / 10 |
| 32 | Panama | 7.66 / 10 |
| 33 | Malaysia | 7.58 / 10 |
| 34 | Belgium | 7.55 / 10 |
| 35 | Armenia | 7.53 / 10 |
| 36 | France its history → | 7.52 / 10 |
| 37 | Dominican Republic | 7.5 / 10 |
| 38 | Jamaica | 7.46 / 10 |
| 39 | Slovakia | 7.46 / 10 |
| 40 | Peru | 7.45 / 10 |
| 41 | United Arab Emirates | 7.43 / 10 |
| 42 | Italy | 7.42 / 10 |
| 43 | Norway | 7.42 / 10 |
| 44 | Hungary its history → | 7.41 / 10 |
| 45 | Jordan | 7.39 / 10 |
| 46 | Israel | 7.36 / 10 |
| 47 | Romania | 7.36 / 10 |
| 48 | South Korea | 7.35 / 10 |
| 49 | Bulgaria | 7.32 / 10 |
| 50 | Slovenia | 7.32 / 10 |
| 51 | Montenegro | 7.31 / 10 |
| 52 | Thailand | 7.24 / 10 |
| 53 | El Salvador | 7.22 / 10 |
| 54 | Uruguay | 7.19 / 10 |
| 55 | Saudi Arabia | 7.18 / 10 |
| 56 | Brunei | 7.17 / 10 |
| 57 | Greece | 7.17 / 10 |
| 58 | Philippines | 7.17 / 10 |
| 59 | Croatia | 7.12 / 10 |
| 60 | Poland | 7.11 / 10 |
| 61 | Paraguay | 7.1 / 10 |
| 62 | Honduras | 7.06 / 10 |
| 63 | Gambia | 6.99 / 10 |
| 64 | Cambodia | 6.99 / 10 |
| 65 | Botswana | 6.98 / 10 |
| 66 | Qatar | 6.98 / 10 |
| 67 | Indonesia | 6.97 / 10 |
| 68 | Mongolia | 6.96 / 10 |
| 69 | North Macedonia | 6.95 / 10 |
| 70 | Kazakhstan | 6.9 / 10 |
| 71 | Rwanda | 6.85 / 10 |
| 72 | Mexico | 6.84 / 10 |
| 73 | Bahamas | 6.82 / 10 |
| 74 | Trinidad & Tobago | 6.82 / 10 |
| 75 | Uganda | 6.82 / 10 |
| 76 | Bhutan | 6.72 / 10 |
| 77 | Moldova | 6.68 / 10 |
| 78 | Serbia | 6.66 / 10 |
| 79 | Brazil | 6.65 / 10 |
| 80 | Kenya | 6.65 / 10 |
| 81 | South Africa | 6.64 / 10 |
| 82 | India its history → | 6.63 / 10 |
| 83 | Oman | 6.63 / 10 |
| 84 | Nepal | 6.6 / 10 |
| 85 | Kuwait | 6.57 / 10 |
| 86 | Morocco | 6.57 / 10 |
| 87 | Kyrgyzstan | 6.56 / 10 |
| 88 | Nicaragua | 6.51 / 10 |
| 89 | Bosnia & Herzegovina | 6.5 / 10 |
| 90 | Tajikistan | 6.47 / 10 |
| 91 | Colombia | 6.46 / 10 |
| 92 | Ecuador | 6.46 / 10 |
| 93 | Benin | 6.42 / 10 |
| 94 | Senegal | 6.38 / 10 |
| 95 | Namibia | 6.35 / 10 |
| 96 | Somalia | 6.34 / 10 |
| 97 | Nigeria | 6.29 / 10 |
| 98 | Tanzania | 6.27 / 10 |
| 99 | Mozambique | 6.25 / 10 |
| 100 | Djibouti | 6.23 / 10 |
| 101 | Côte d’Ivoire | 6.21 / 10 |
| 102 | Mauritania | 6.18 / 10 |
| 103 | Madagascar | 6.17 / 10 |
| 104 | China | 6.15 / 10 |
| 105 | Vietnam | 6.15 / 10 |
| 106 | Zambia | 6.14 / 10 |
| 107 | Azerbaijan | 6.11 / 10 |
| 108 | Guinea | 6.09 / 10 |
| 109 | Papua New Guinea | 6.07 / 10 |
| 110 | Liberia | 6.06 / 10 |
| 111 | Togo | 6.06 / 10 |
| 112 | Belize | 6 / 10 |
| 113 | Sri Lanka | 5.99 / 10 |
| 114 | Mali | 5.99 / 10 |
| 115 | Lesotho | 5.93 / 10 |
| 116 | Timor-Leste | 5.93 / 10 |
| 117 | Fiji | 5.92 / 10 |
| 118 | Niger | 5.91 / 10 |
| 119 | Belarus | 5.9 / 10 |
| 120 | Ghana | 5.9 / 10 |
| 121 | Tunisia | 5.9 / 10 |
| 122 | Haiti | 5.89 / 10 |
| 123 | Bangladesh | 5.82 / 10 |
| 124 | Suriname | 5.79 / 10 |
| 125 | Burkina Faso | 5.73 / 10 |
| 126 | Pakistan | 5.71 / 10 |
| 127 | Ethiopia | 5.69 / 10 |
| 128 | Lebanon | 5.69 / 10 |
| 129 | Ukraine its history → | 5.69 / 10 |
| 130 | Laos | 5.68 / 10 |
| 131 | Sierra Leone | 5.68 / 10 |
| 132 | Cameroon | 5.63 / 10 |
| 133 | Guinea-Bissau | 5.61 / 10 |
| 134 | Guyana | 5.6 / 10 |
| 135 | Türkiye | 5.59 / 10 |
| 136 | Russia | 5.5 / 10 |
| 137 | Bolivia | 5.48 / 10 |
| 138 | Eswatini | 5.42 / 10 |
| 139 | Gabon | 5.36 / 10 |
| 140 | Burundi | 5.21 / 10 |
| 141 | Chad | 5.15 / 10 |
| 142 | Central African Republic | 5.02 / 10 |
| 143 | Angola | 4.88 / 10 |
| 144 | Argentina its history → | 4.87 / 10 |
| 145 | Iraq | 4.86 / 10 |
| 146 | Syria | 4.86 / 10 |
| 147 | Yemen | 4.84 / 10 |
| 148 | Congo - Brazzaville | 4.82 / 10 |
| 149 | Congo - Kinshasa | 4.81 / 10 |
| 150 | Egypt | 4.8 / 10 |
| 151 | Malawi | 4.76 / 10 |
| 152 | Algeria | 4.55 / 10 |
| 153 | Iran | 4.52 / 10 |
| 154 | Myanmar (Burma) | 4.45 / 10 |
| 155 | Libya | 4.3 / 10 |
| 156 | Sudan | 4.17 / 10 |
| 157 | Zimbabwe | 3.63 / 10 |
| 158 | Venezuela | 2.95 / 10 |
20 countries or territories have no value that year.
Continent averages
| World (population-weighted average) | 6.43 / 10 |
| Europe (average) | 6.94 / 10 |
| Africa (average) | 5.75 / 10 |
| Americas (average) | 7.13 / 10 |
| Asia (average) | 6.39 / 10 |
| Oceania (average) | 7.58 / 10 |
Understanding this map
What the index measures
Economic Freedom of the World has been published every year since 1996 by the Fraser Institute, a Canadian free-market think tank, with a network of partner institutes. It combines about forty data series (World Bank, IMF, World Economic Forum surveys…) into five areas scored 0 to 10: size of government, legal system and property rights, sound money, freedom to trade internationally, regulation. The overall score is their average. The buttons above the legend show each area.
The big shifts
At the top in 2024: Switzerland, Singapore, New Zealand, the United States, Ireland, Denmark (Hong Kong, first in the ranking, has no outline on this map). At the bottom: Venezuela (3.0), Zimbabwe, Sudan, Libya, Myanmar. The lines tell stories of reform: New Zealand after 1984 (6.8 in 1985, 8.7 in 2000), Chile after 1975 (4.2, then 7.6 in 1995), Poland and Estonia after the fall of communism, India after 1991, China since 1980 (4.8 → 6.2, with a setback around 1990). A collapse: Venezuela, 18th of 94 countries rated in 1970 (6.8), last since 2008. And round trips: Argentina goes from 3.3 in 1975 to 7.3 in 2000, then falls back to 4.9.
Economic freedom and wealth
The best-rated countries are generally richer: in 2024 the correlation between the overall score and GDP per person (on a log scale) is about 0.66. But the five areas do not say the same thing. The strongest link is with law and property (r ≈ 0.79); the weakest, even negative, with size of government (r ≈ −0.30): rich countries often have bigger states. Denmark, Sweden or France score about 5 on that area, lower than India (7.9) or the United States (7.4), but 7 to 9.5 on law, money and trade; Denmark's overall score (8.1) is almost that of the United States (8.2). Compare with the Correlations tool.
What is debated
For its supporters, the index confirms that open markets, protected property and stable money foster prosperity; several studies link rises in the score to faster growth in the following years (for example De Haan and Sturm, 2000). Its critics reply that the link may run the other way (a rich country can afford reliable judges and a stable currency), and that the definition of “freedom” is a choice: a high tax, a minimum wage or protection against dismissal lowers the score, whatever their effect on people's lives. Nor does it measure political freedom: Singapore is at the top without being a democracy (see the democracy index).
Limits
Before 2000 the index is only computed every five years: the years in between are interpolated (“estimated between” in the tooltip). From 1950 to 1965 only the overall score exists, estimated after the fact with less data: linking it to 1970 calls for caution. The map uses the “panel” version of the dataset, which the institute recommends for comparing years (missing components are filled in); its scores differ slightly from the ranking published each year (under 0.05 points since 2013, 0.3 to 0.5 points in the 1970s). Some countries are not rated for lack of reliable data, including North Korea and Cuba. Part of the components come from surveys of business executives. World and continent averages are weighted by population: China and India weigh heavily.
Sources : Fraser Institute, Economic Freedom of the World (édition 2026, base « panel »)
In the same theme : Wealth
All maps
Page updated on 2026-11-03.