All world maps
About thirty interactive world maps, from 1800 to today: democracy, life expectancy, wealth, inequality, poverty, public debt, taxes, CO₂, energy, population, religion, passports… Each map has its full country ranking and an explanatory note.
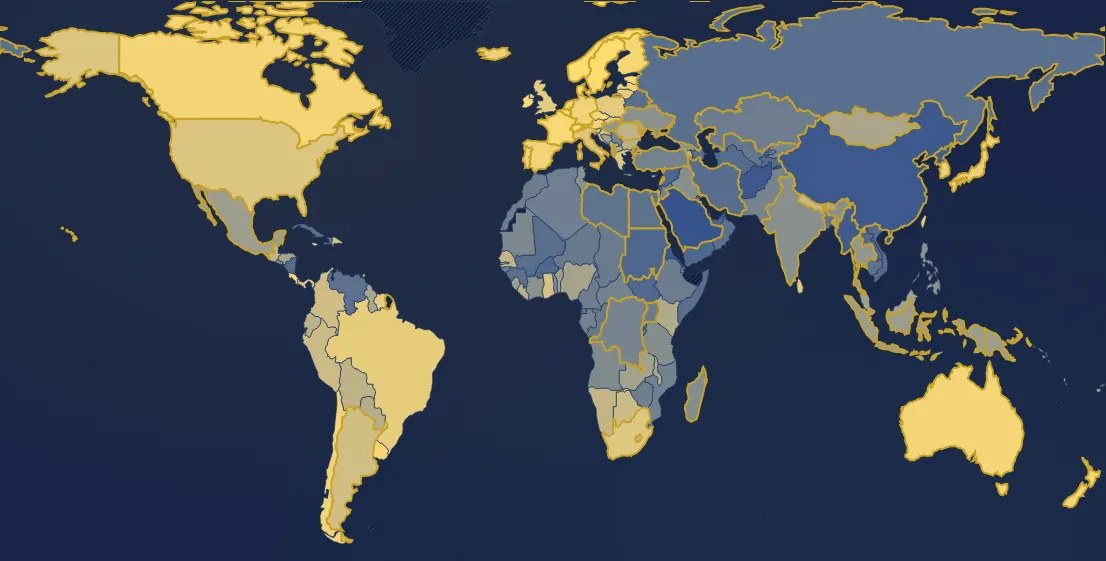 DemocracyElectoral democracy indexFrom 0 to 1: how far rulers are chosen in free, competitive elections, with freedom of expression and association and broad suffrage.
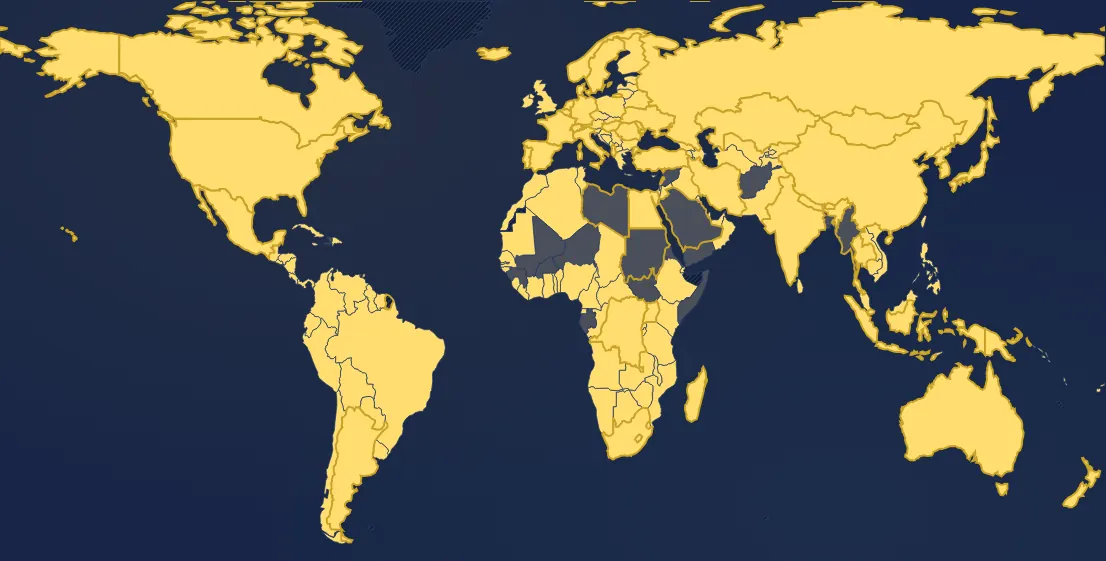 DemocracyWomen's right to voteCan women vote in national elections, and on the same terms as men? The map also shows countries with no national elections, where nobody votes.
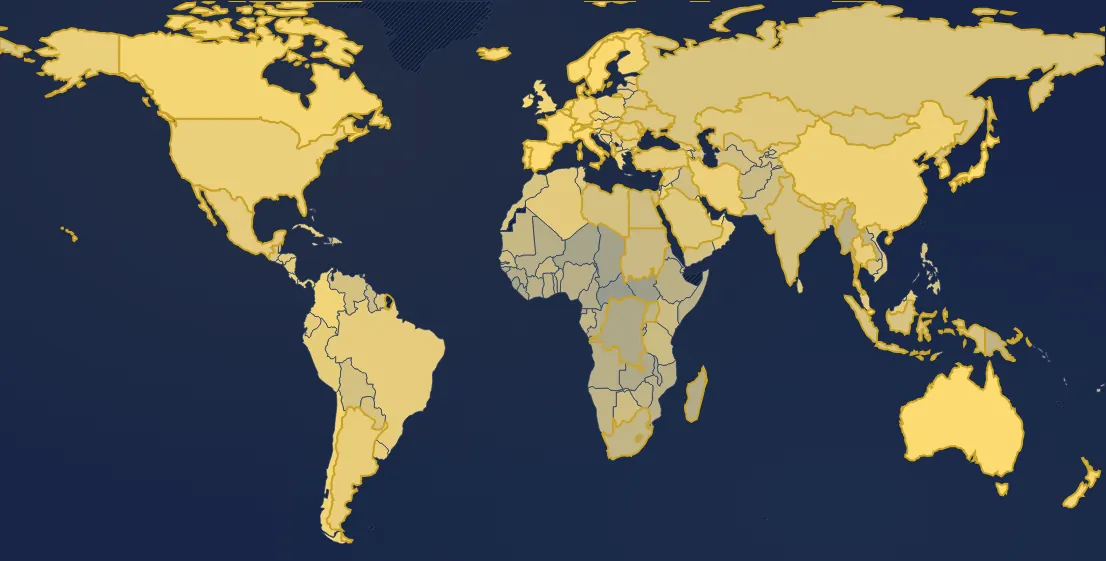 Life expectancyLife expectancy at birthAverage number of years a newborn would live if that year's mortality stayed the same all its life.
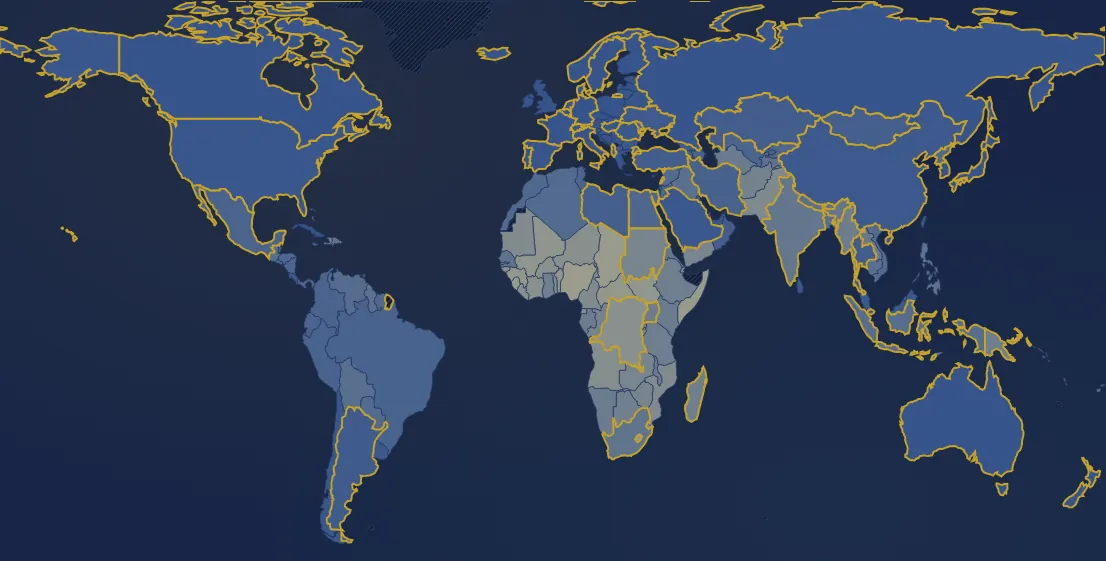 Child mortalityChildren dying before age 5Share of children born alive who die before their fifth birthday.
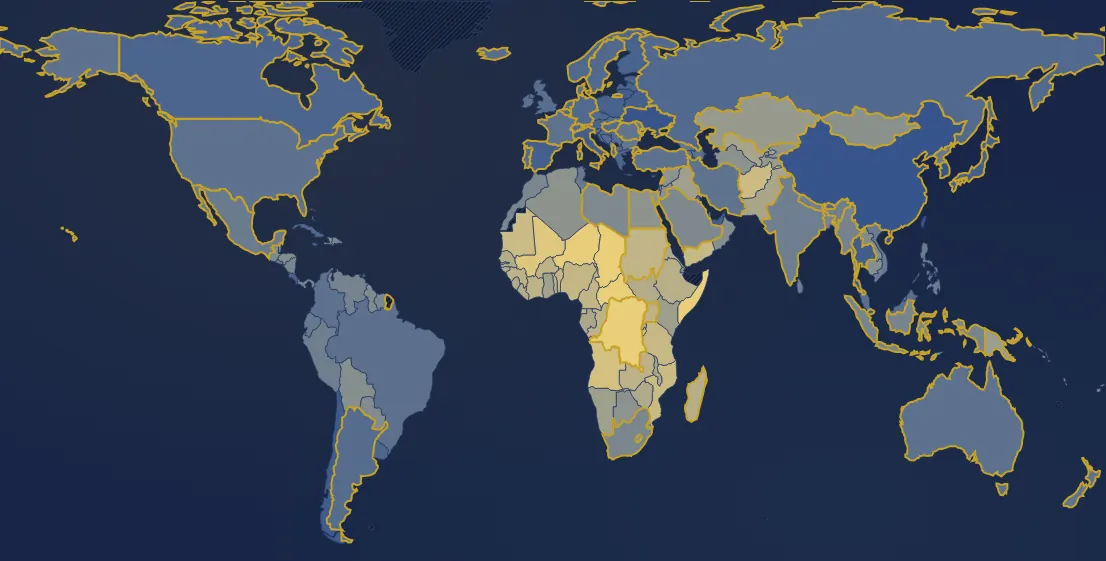 FertilityChildren per womanAverage number of children a woman would have over her lifetime at that year's fertility.
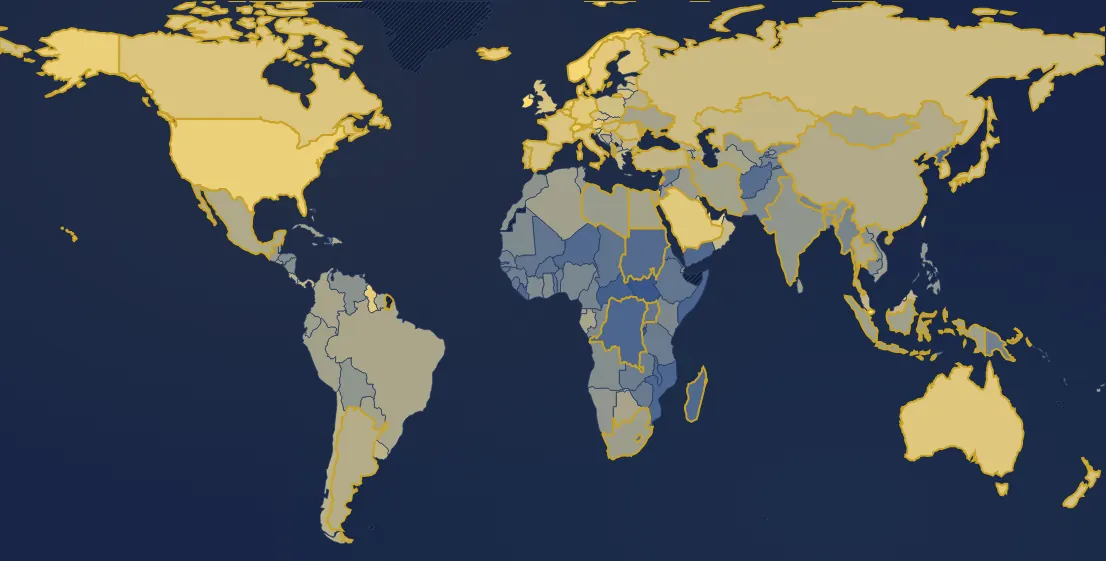 WealthGDP per capitaEverything the country produces in a year, divided by its population, in dollars adjusted for inflation and the cost of living.
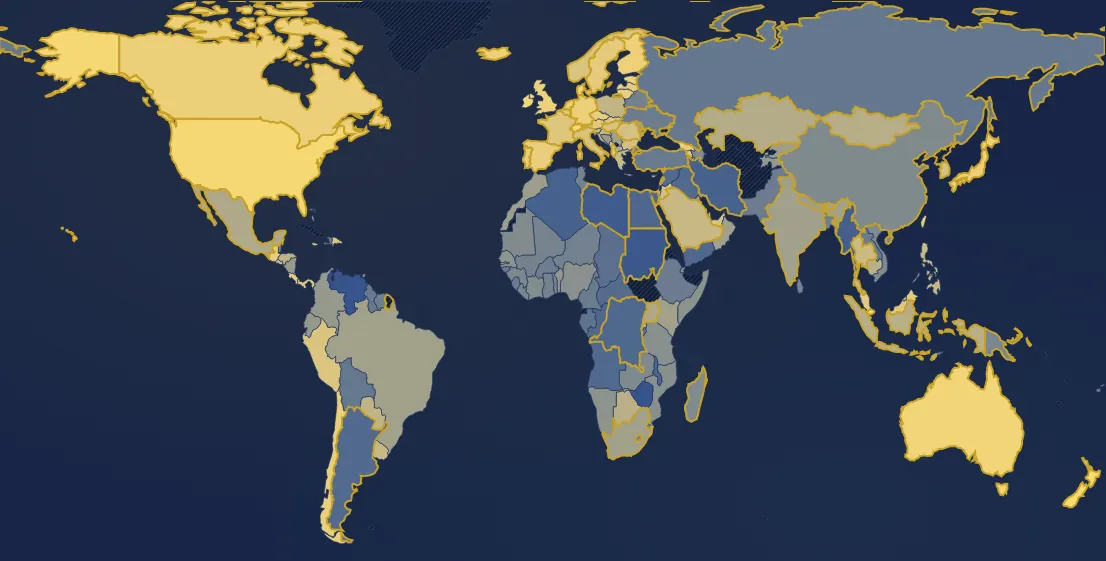 WealthEconomic freedom indexA 0-to-10 score computed by the Fraser Institute: the higher it is, the freer trade, prices and property are from state intervention, and the better the law protects them.
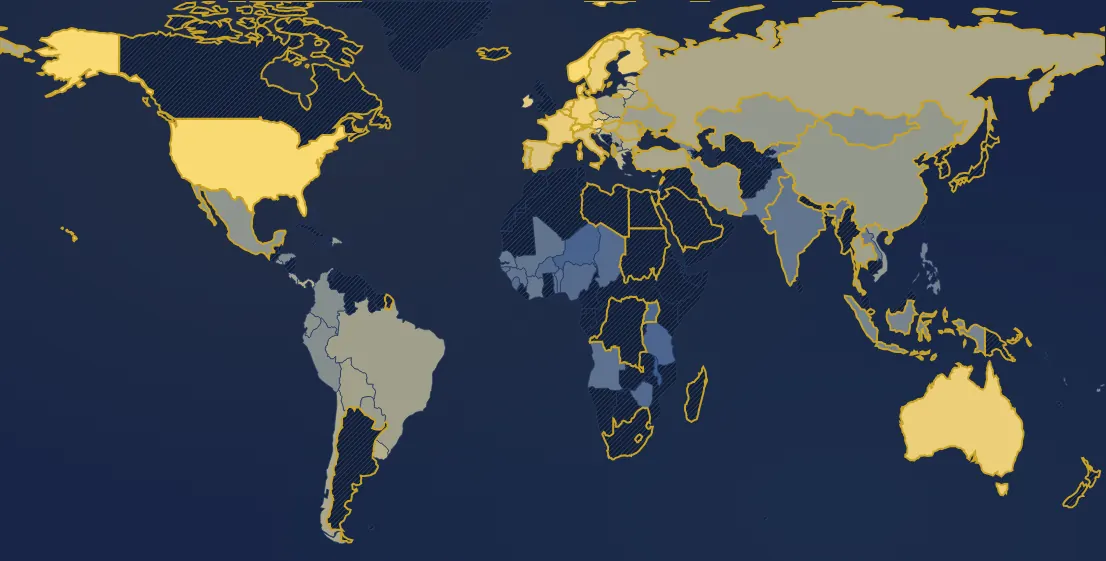 Median incomeMedian income per person per monthHalf the population lives on less, half on more. After taxes and benefits, in dollars adjusted for the cost of living (2017).
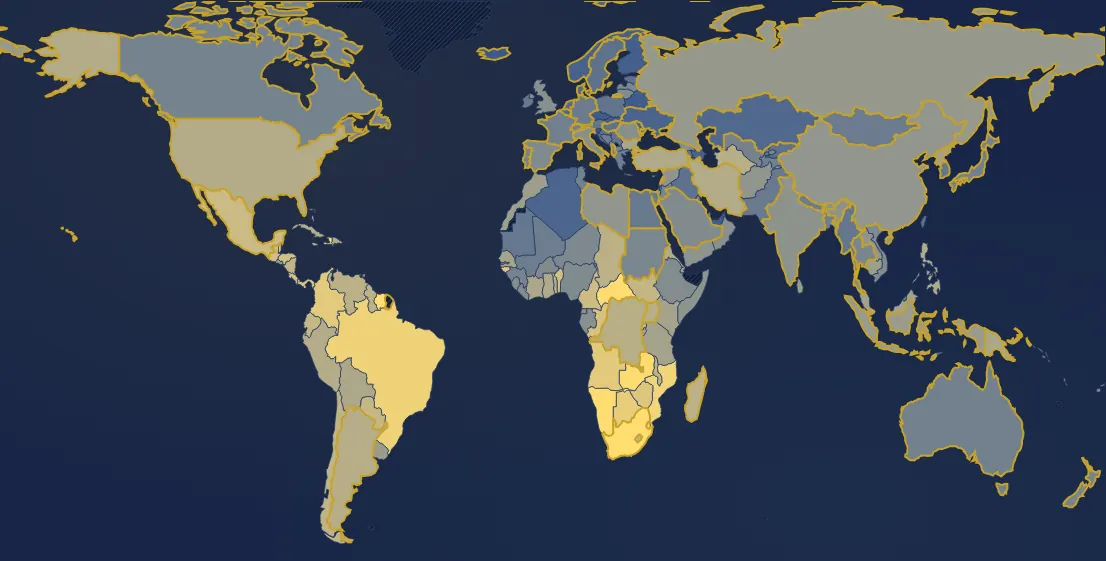 InequalityIncome inequality (Gini index)0 if everyone has the same income, 100 if one person has everything. The higher the figure, the more unequal incomes are within the country.
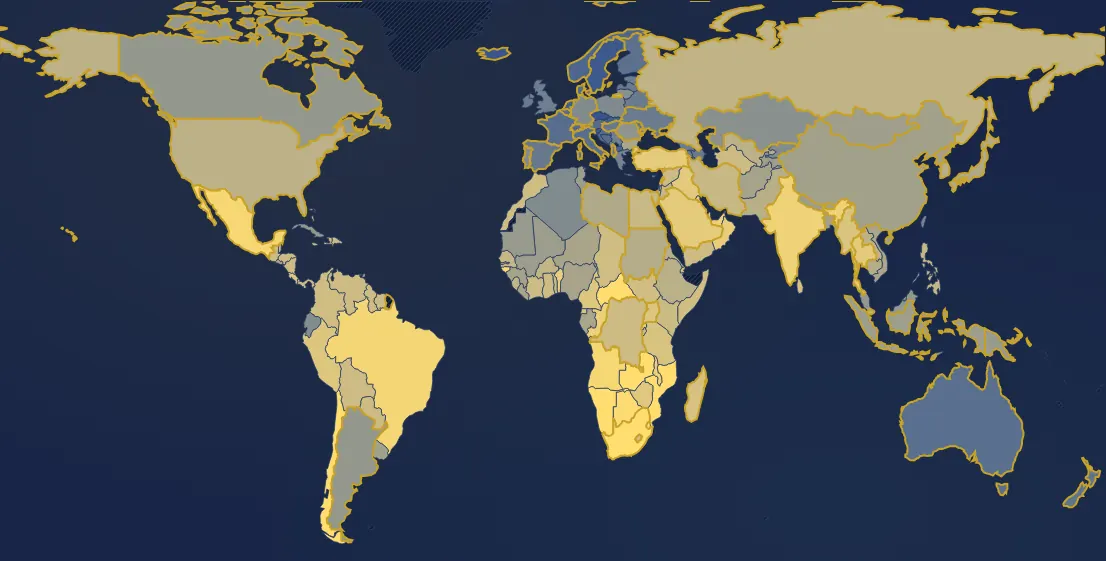 InequalityIncome share of the richest 10%The share of national income going to the best-paid 10% of adults, before taxes and social benefits. 10% would mean perfect equality.
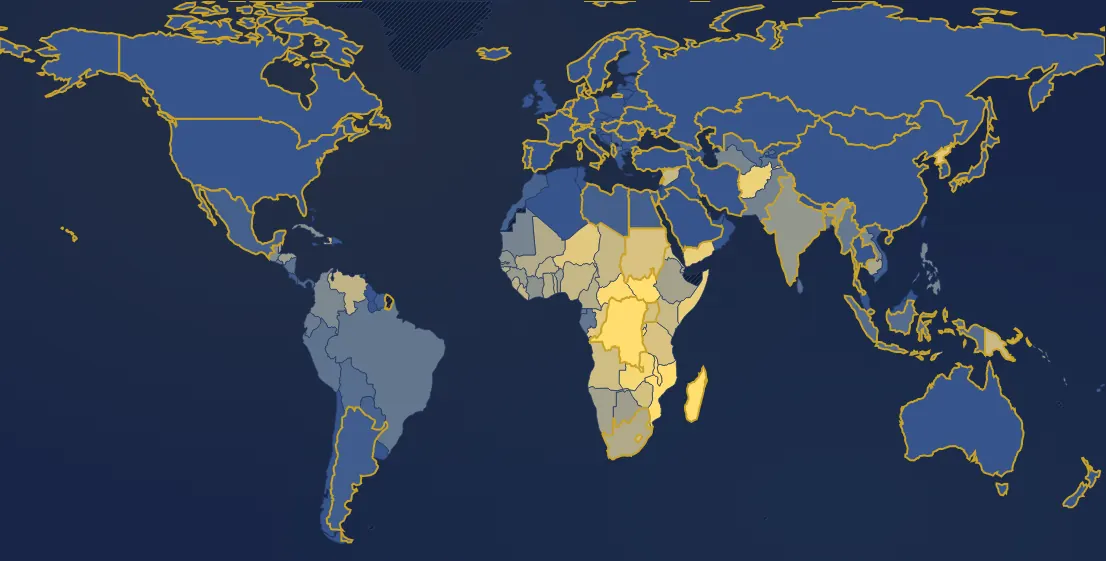 InequalityExtreme poverty (under $2.15 a day)The share of people living on less than 2.15 dollars a day, in dollars adjusted for the cost of living (World Bank line, 2017 prices).
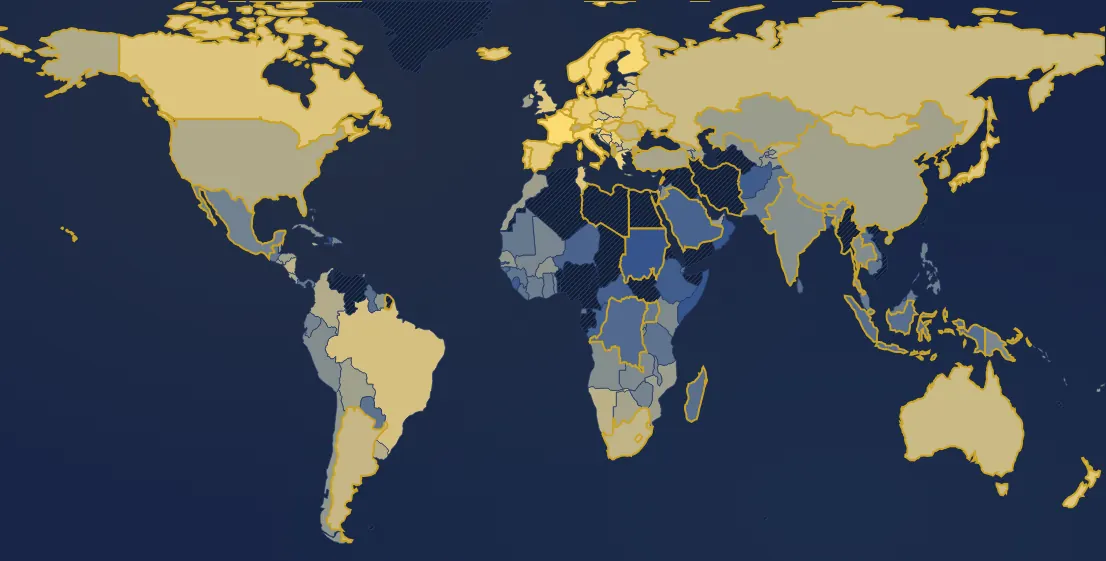 Public financesTax revenueAll taxes and social contributions collected during the year, as a share of the wealth the country produces (GDP).
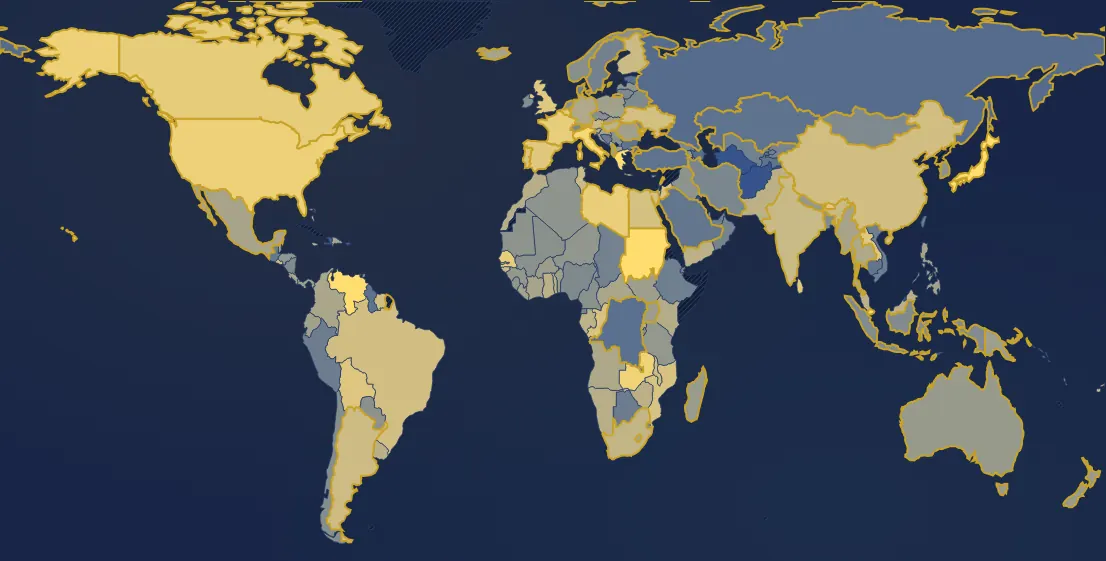 Public financesPublic debtEverything owed by the state, local authorities and social security, as a share of the wealth the country produces in a year (GDP). 100% = a full year of output.
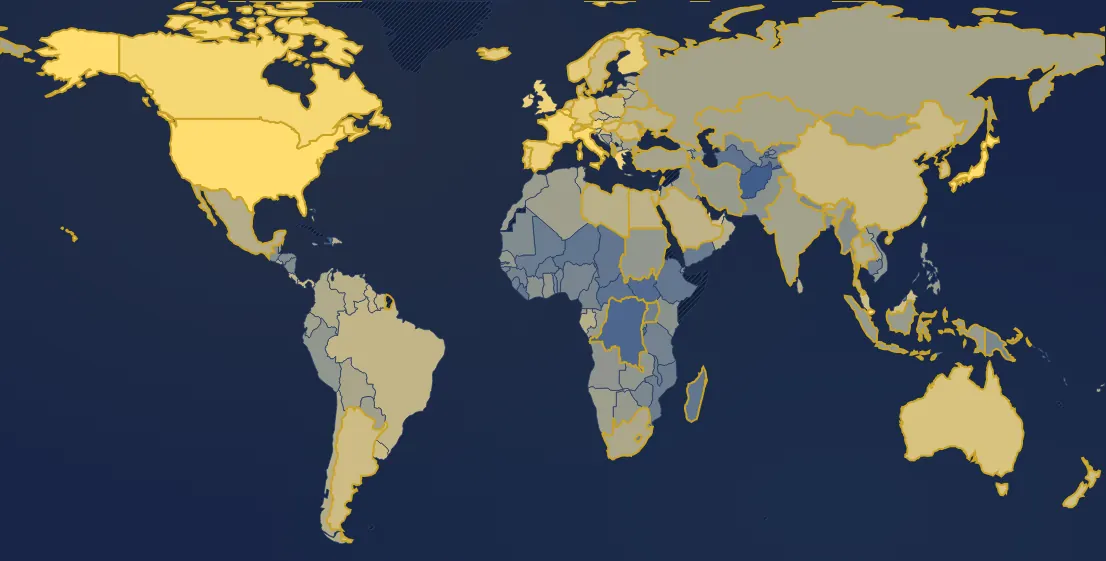 Public financesPublic debt per personPublic debt divided by the population, in dollars adjusted for inflation and the cost of living.
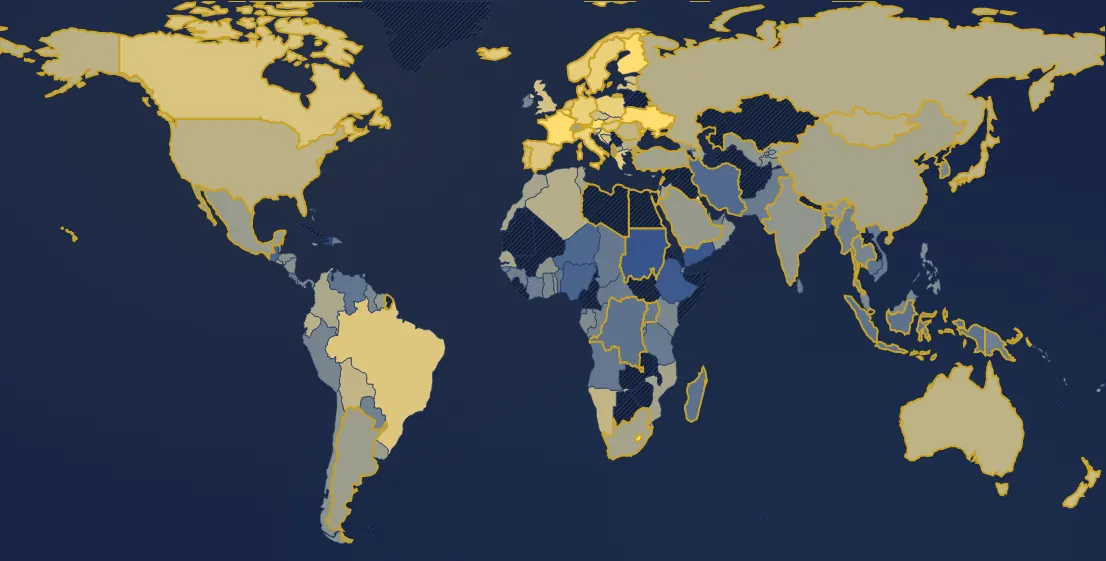 Public financesPublic spendingEverything spent in a year by the state, local authorities and social security, as a share of the wealth the country produces (GDP).
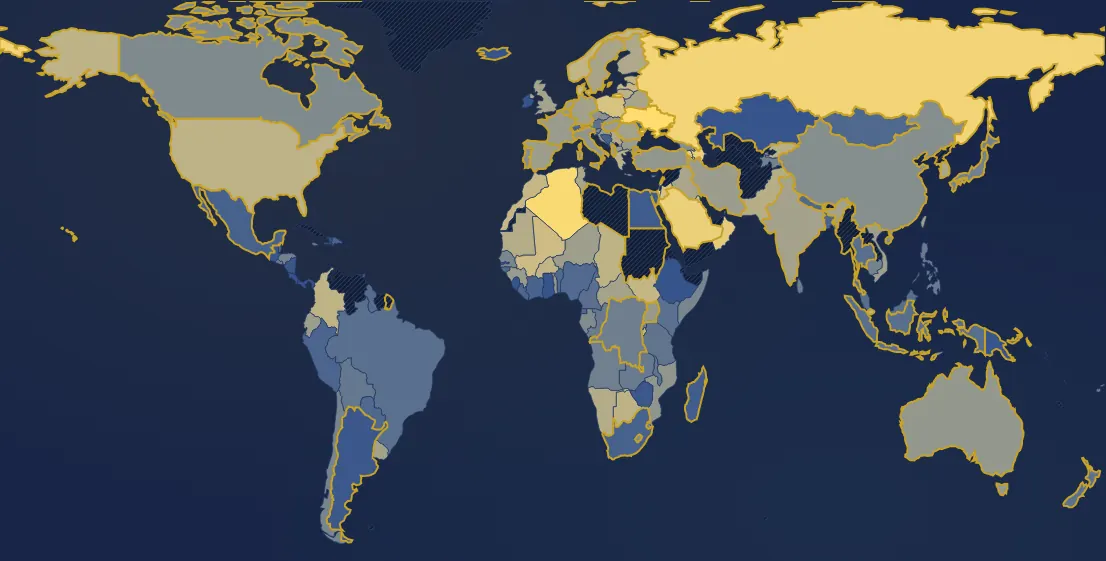 Public financesMilitary spendingWhat the country spends on its armed forces in a year (personnel, weapons, operations, military research), as a share of the wealth produced (GDP).
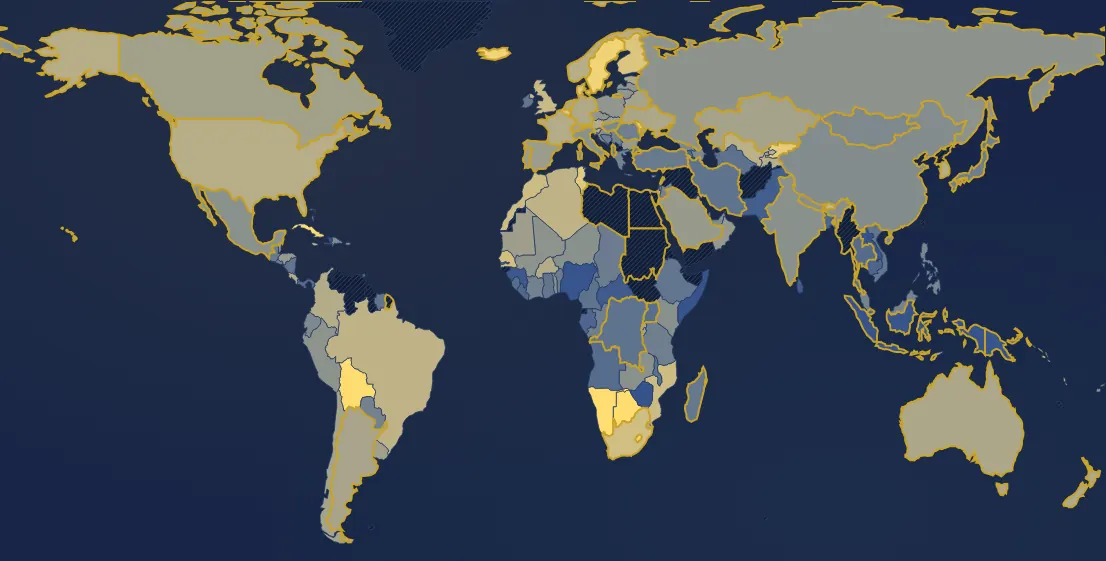 Public financesPublic spending on educationWhat government spends on education, from nursery school to university, as a share of the wealth produced (GDP).
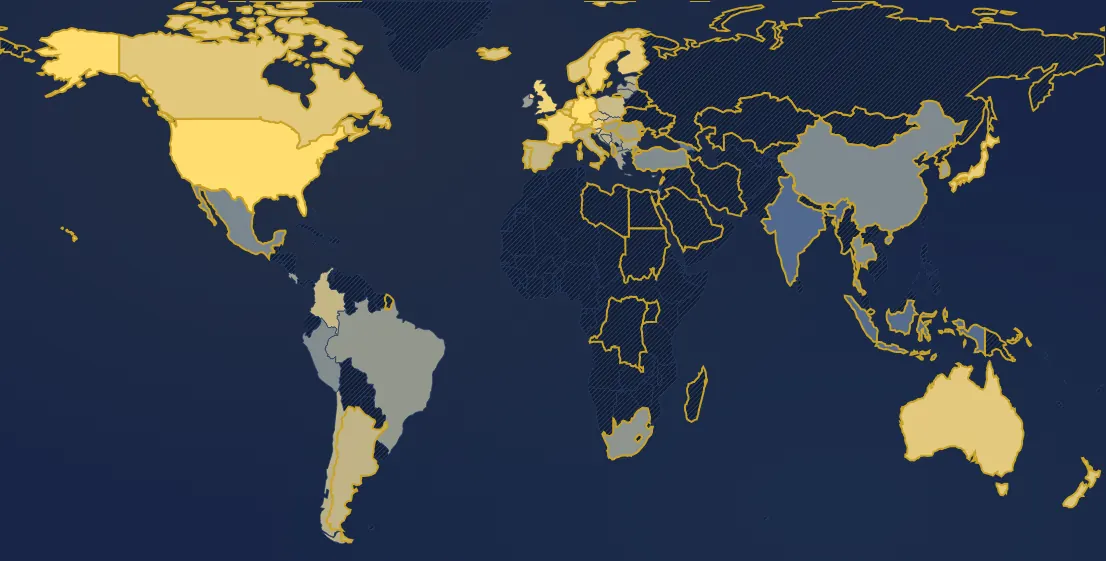 Public financesPublic spending on healthCare paid for by the state and compulsory health insurance (hospitals, doctors, medicines), as a share of the wealth produced (GDP).
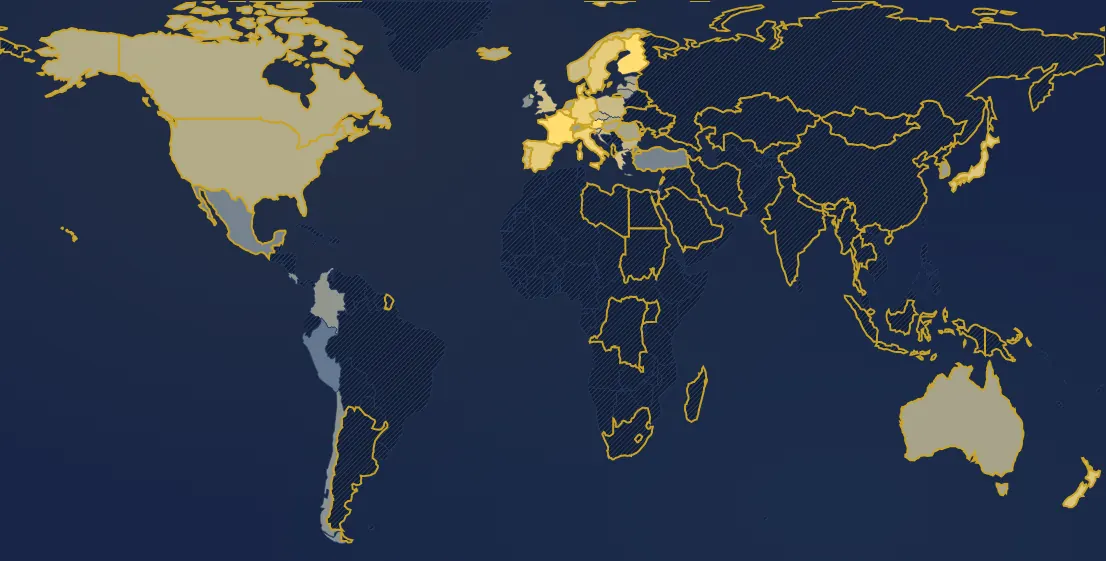 Public financesPublic social spendingPensions, health, family benefits, unemployment, disability, housing, minimum income… paid by the state and social security, as a share of the wealth produced (GDP).
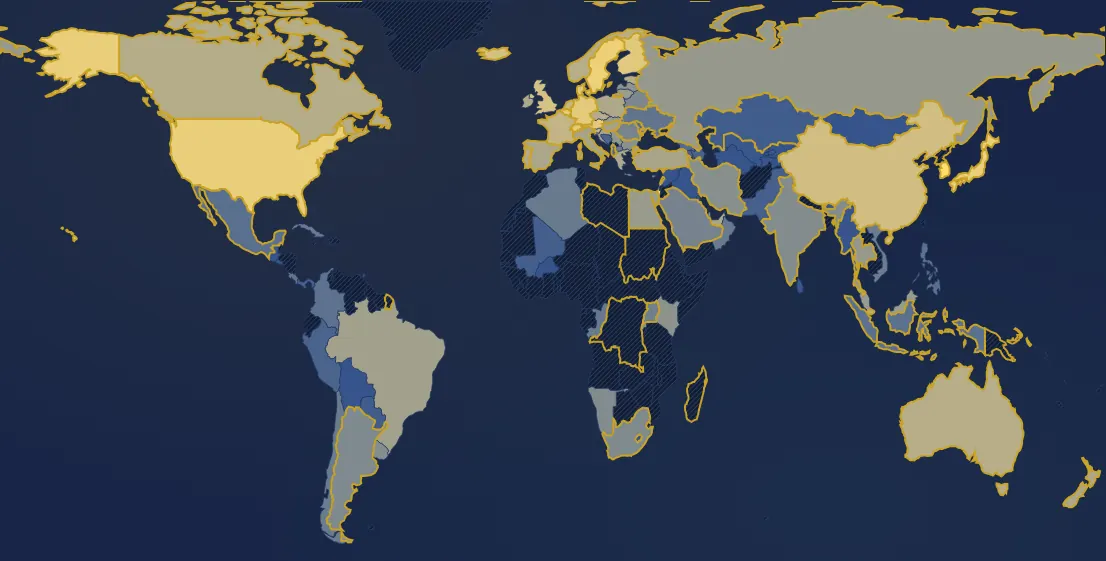 Public financesResearch and development spendingEverything spent in the country on research, public (universities, laboratories) and private (companies), as a share of the wealth produced (GDP).
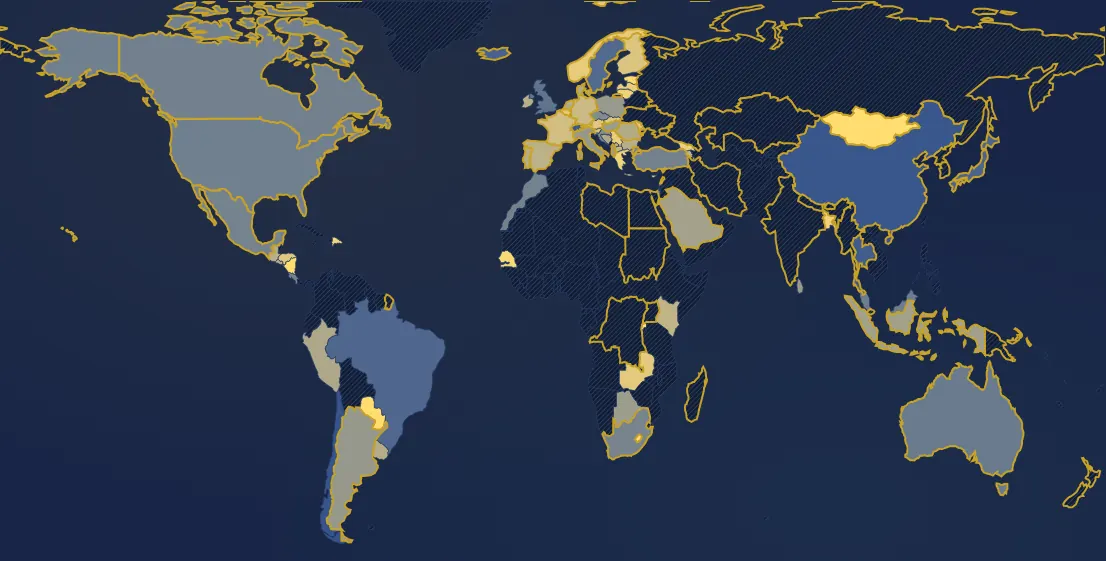 Public financesShare of public debt held abroadWhat share of public debt is held by non-residents: foreign banks, funds, central banks and institutions. The rest belongs to the country's residents (banks, insurers, savers, the central bank).
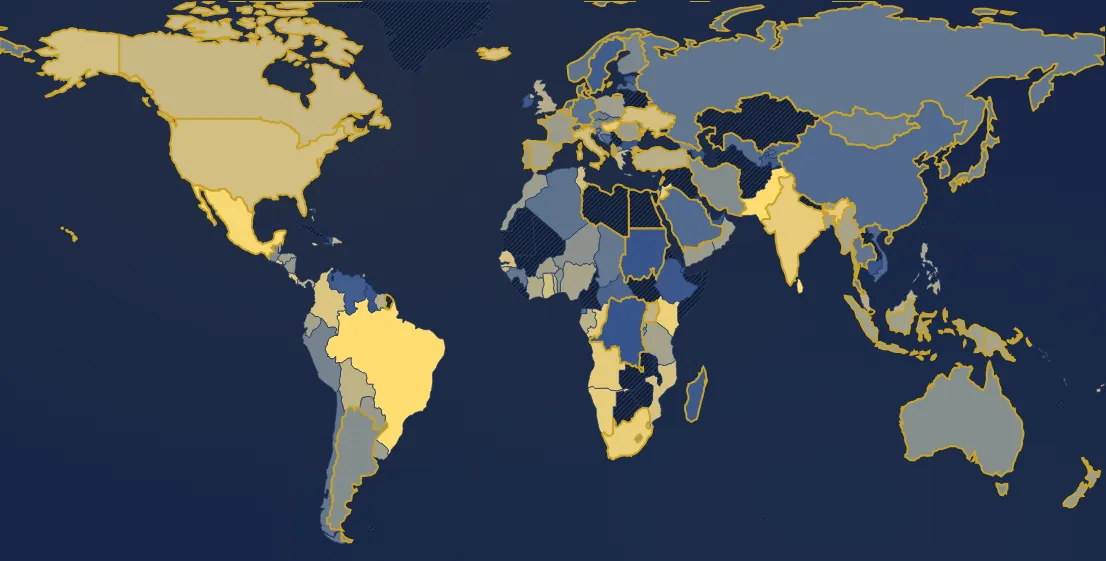 Public financesInterest paid on public debtThe interest government pays each year on its debt, as a share of the wealth the country produces (GDP). The tooltip also gives the average interest rate paid.
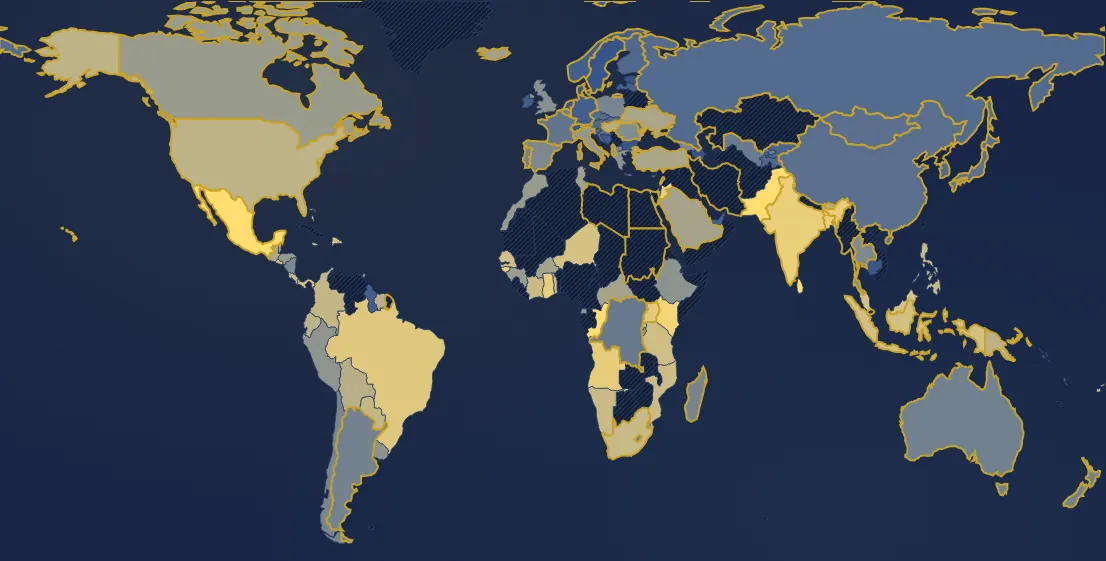 Public financesShare of taxes eaten up by interest on debtThe interest government pays on its debt, compared with everything it collects (taxes and social contributions). At 10%, one euro of tax in ten goes to paying interest.
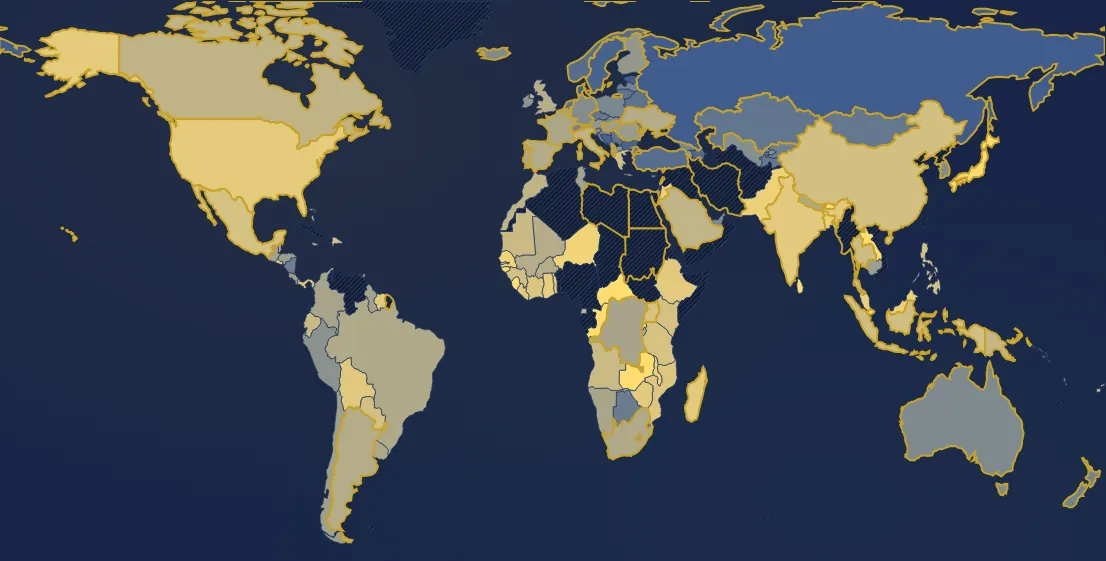 Public financesPublic debt in years of taxesPublic debt divided by what government collects in a year (taxes and social contributions): the number of years of revenue it would take to repay it if nothing else were paid for.
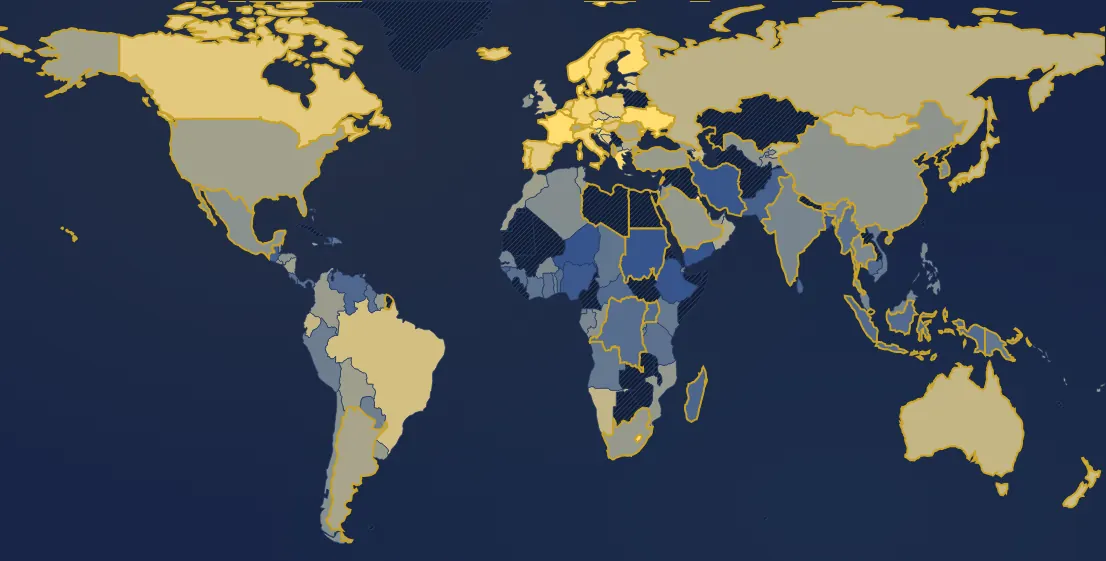 Public financesTotal government revenueEverything the state, local authorities and social security take in during a year: taxes and contributions, but also oil revenue, dividends, sales of services, grants. As a share of GDP.
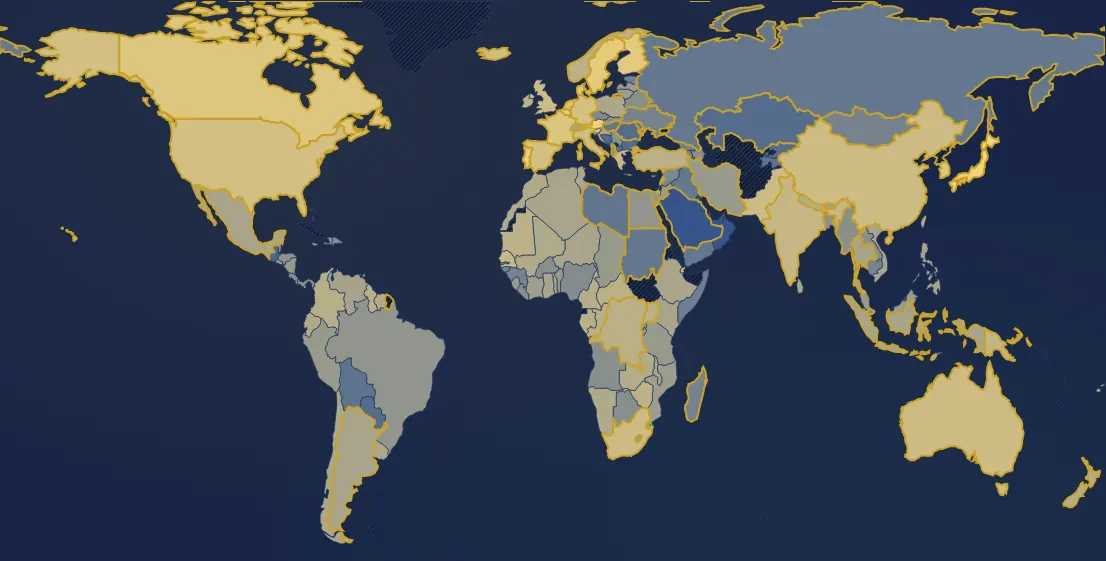 Public financesTop marginal income tax rateThe tax rate on the highest income bracket: the share taken from each extra euro earned above the top threshold.
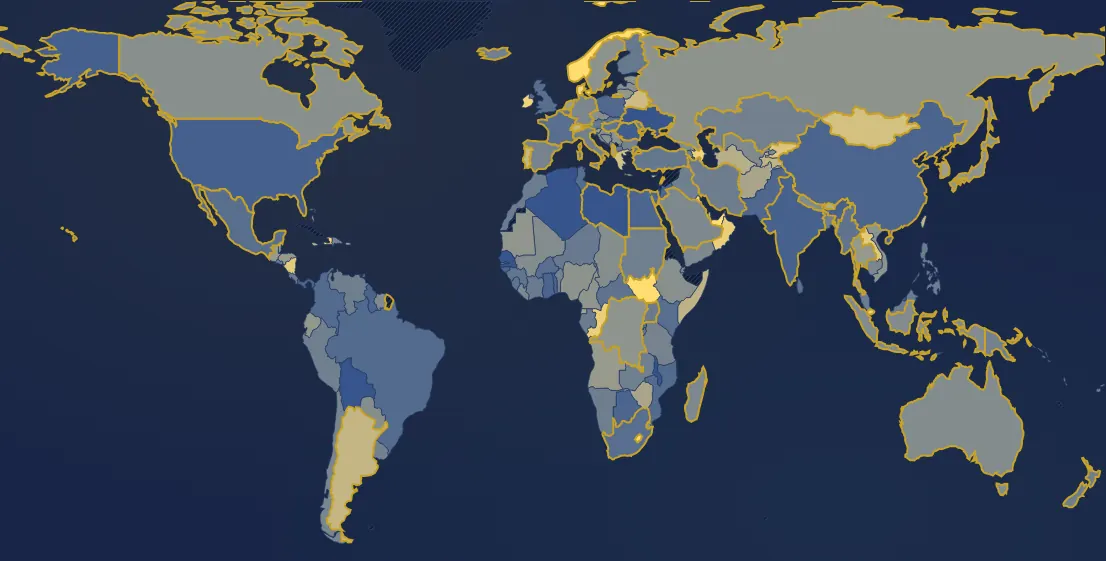 Public financesBudget balance: deficit or surplusGovernment revenue minus spending, as a share of GDP. Negative: a deficit, which the state covers by borrowing. Positive: a surplus.
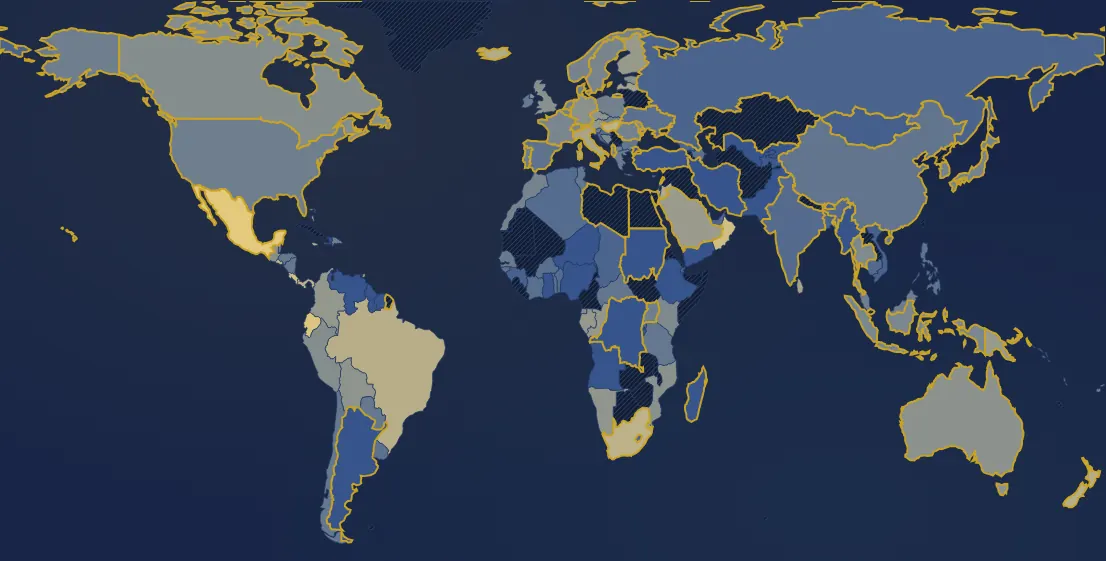 Public financesInterest-growth gap (r − g)The average interest rate paid on debt (r) minus nominal GDP growth (g, growth + inflation). Positive, debt grows by itself; negative, it melts by itself.
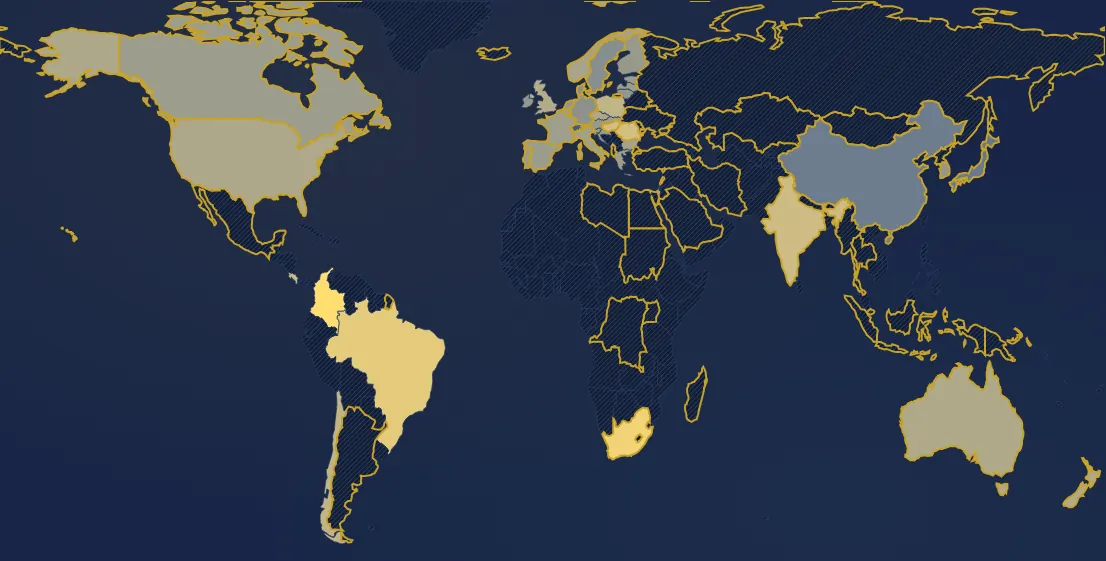 Public finances10-year government borrowing rateThe interest rate at which the state borrows for ten years (yield on its bonds, yearly average): what each new loan costs it.
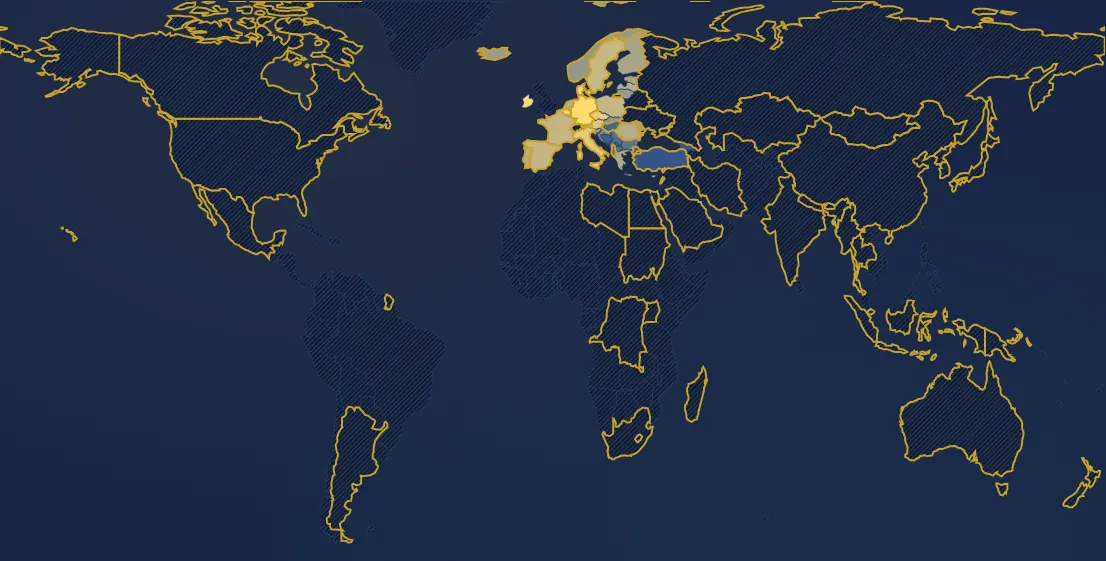 Energy mixHousehold electricity pricesWhat an average household (2,500 to 5,000 kWh a year) pays per kilowatt-hour, taxes included, in euro cents. European data.
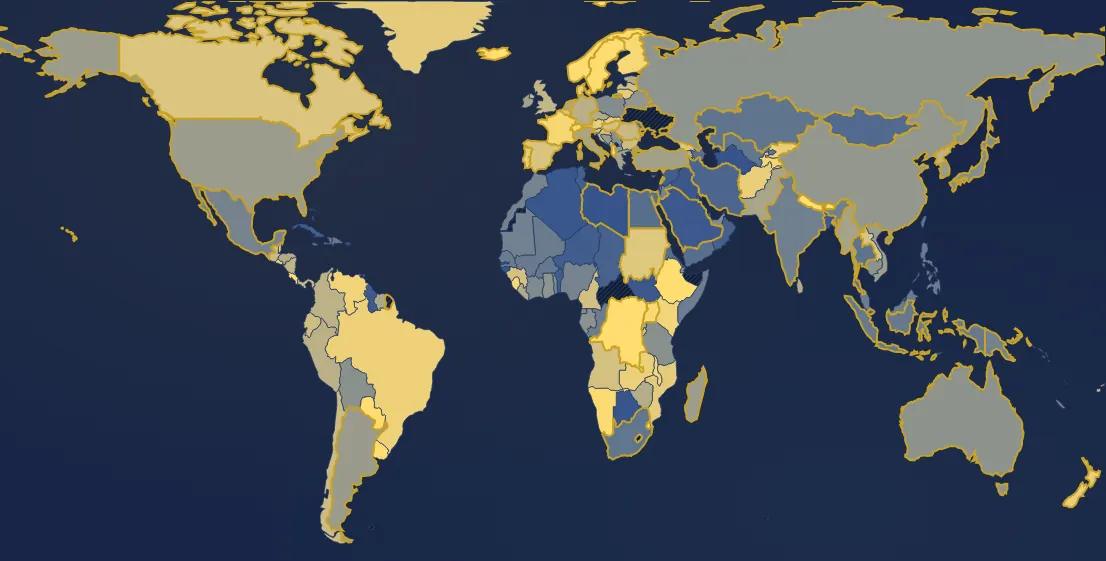 Energy mixShare of electricity from low-carbon (renewables + nuclear) sourcesShare of this source in the electricity the country generated that year. Data from 1985, for about 210 countries.
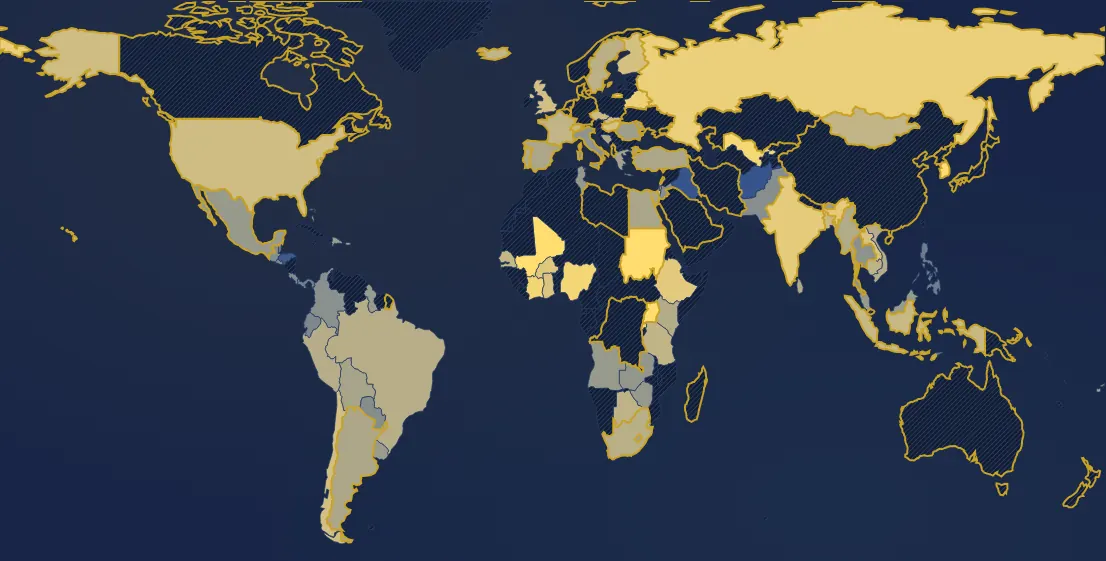 Gender pay gapGender gap in hourly wagesDifference between men's and women's average hourly earnings, as a % of men's earnings. A positive value means men earn more on average, a negative value that women earn more. For equal working time, but without accounting for occupation or job held.
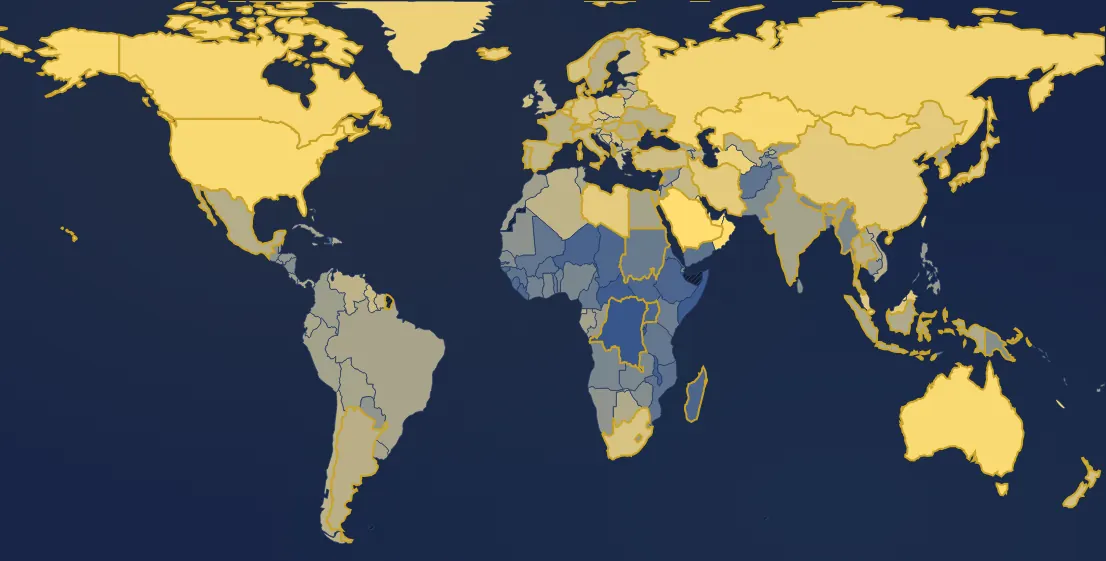 CO₂CO₂ emissions per person — on the territoryTonnes of CO₂ emitted each year on the country's territory, divided by its population.
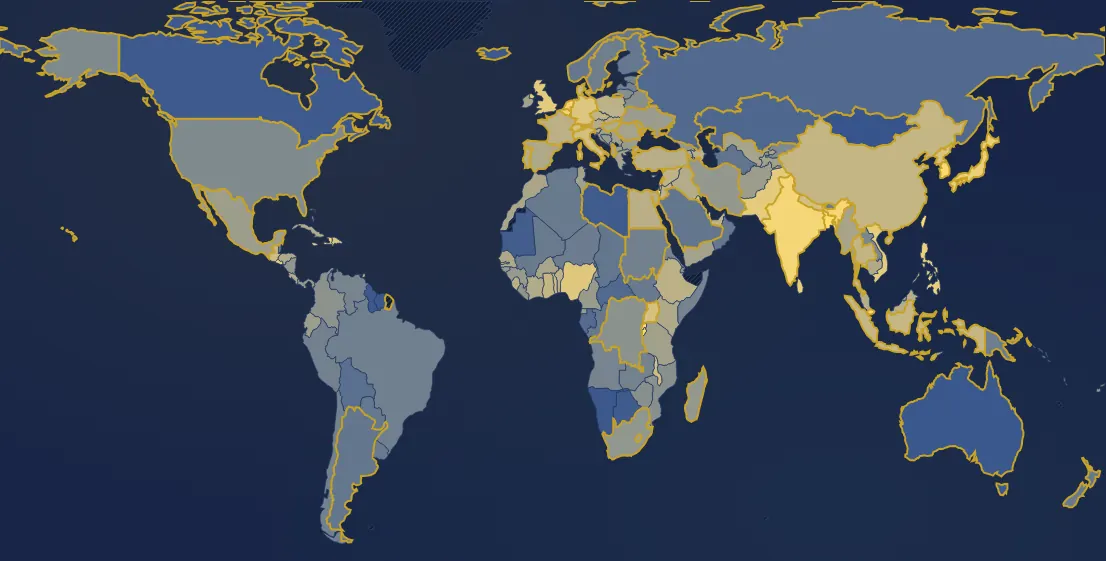 PopulationPopulation and densityThe map shows density (people per km²), the chart the total number of inhabitants, within present-day borders.
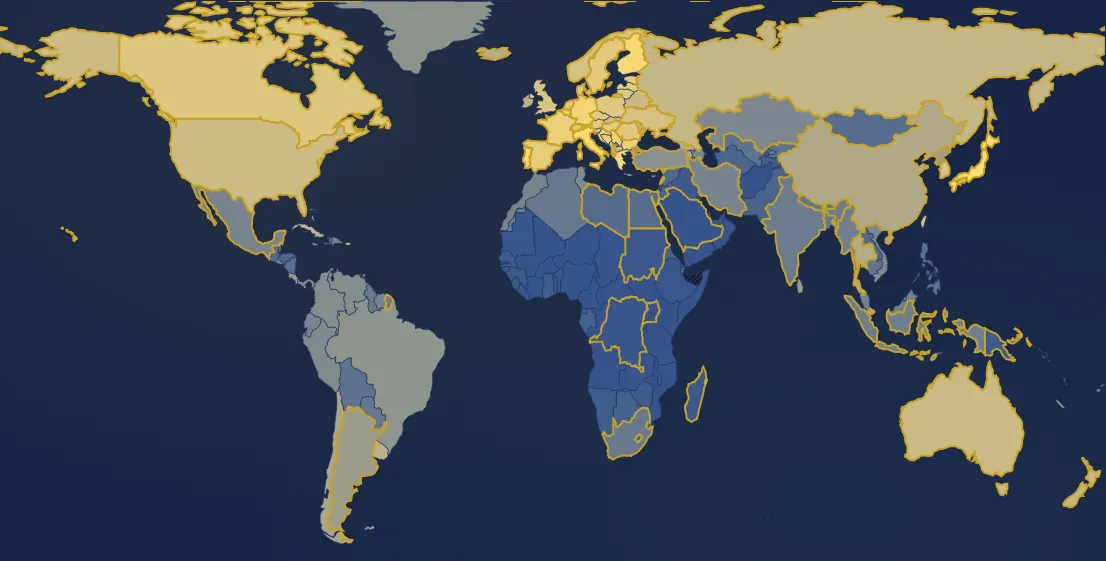 PopulationShare of people aged 65 and overThe share of residents aged 65 or over: population ageing.
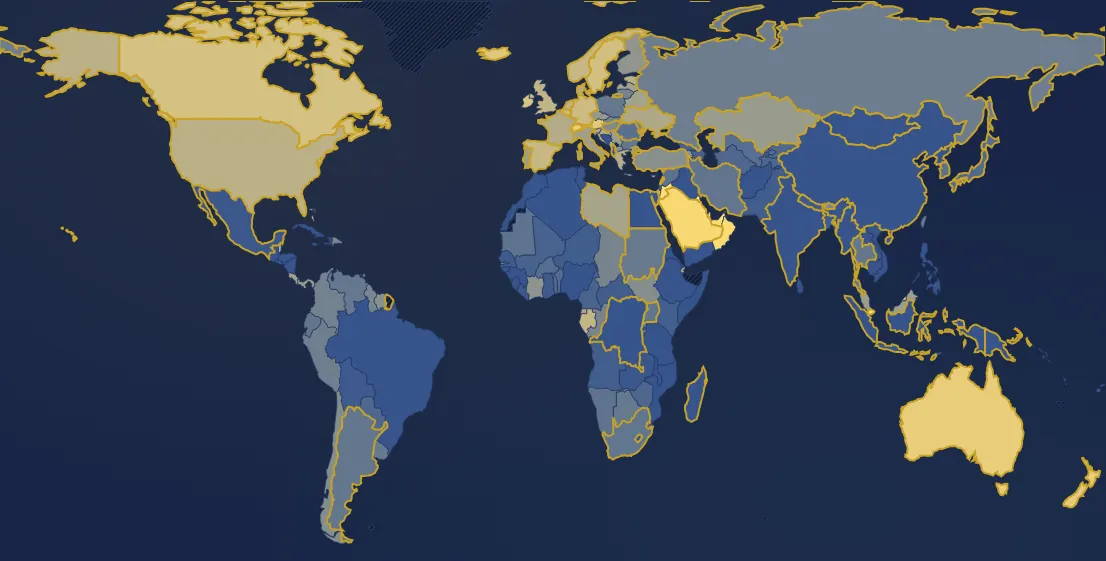 PopulationImmigrants as a share of the populationThe share of residents born in a country other than the one where they live (international migrants, as defined by the UN).
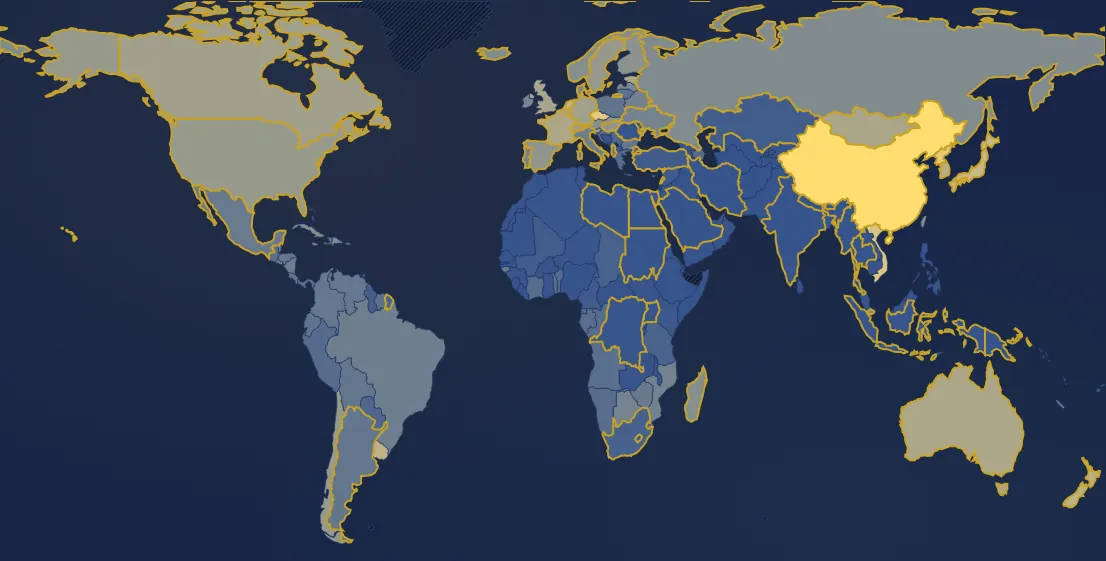 ReligionsShare of people with no religionAtheists, agnostics and people who belong to no religion, as a share of the population (Pew Research Center estimates). Atheists are not counted separately.
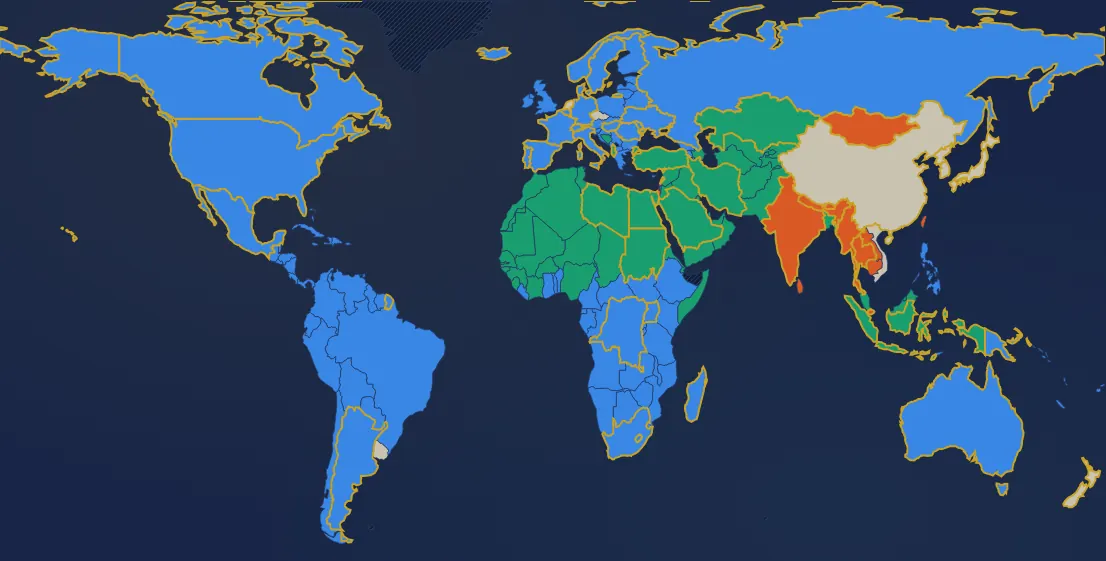 ReligionsLargest religionThe religion (or lack of one) with the most followers in each country. The chart and ranking give its share of the population.
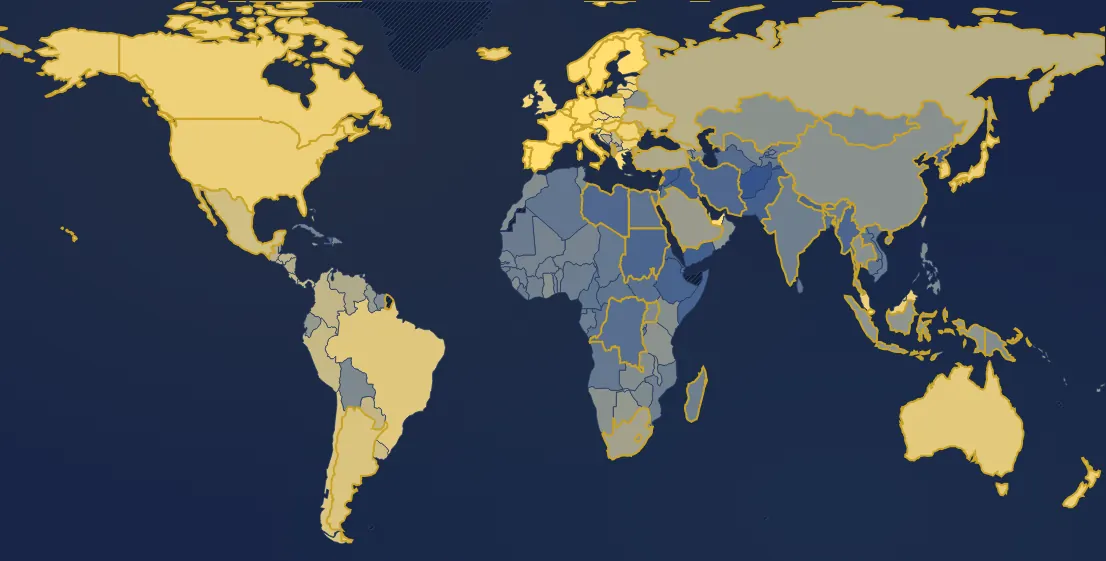 PassportsCountries accessible without a visaFor each passport, the number of countries (out of 198) one can enter without a visa, for a short tourist stay.
Page updated on 2026-11-03.