Extreme poverty (under $2.15 a day)
The share of people living on less than 2.15 dollars a day, in dollars adjusted for the cost of living (World Bank line, 2017 prices).
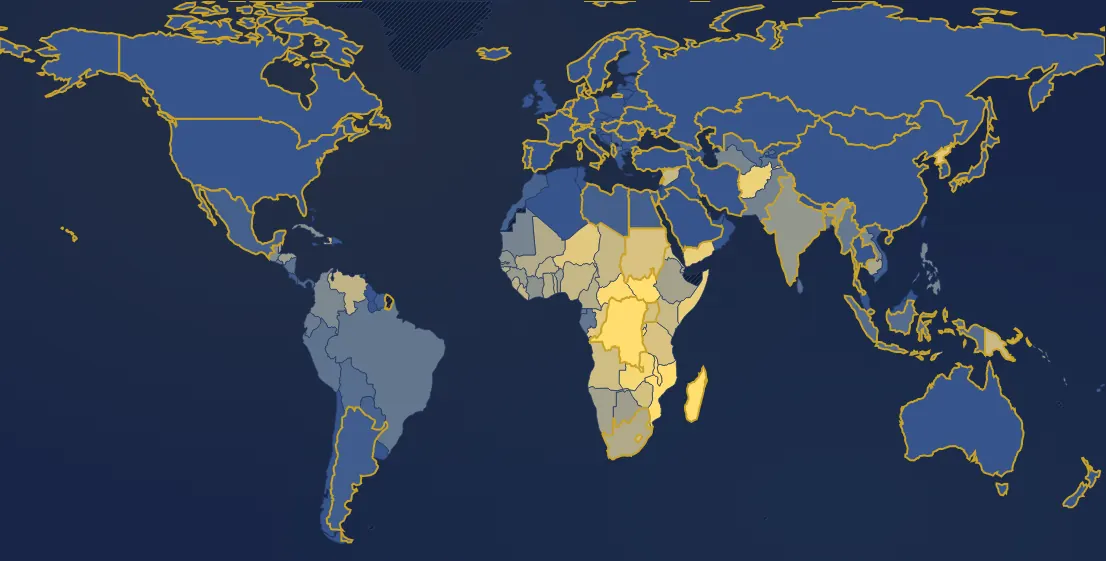
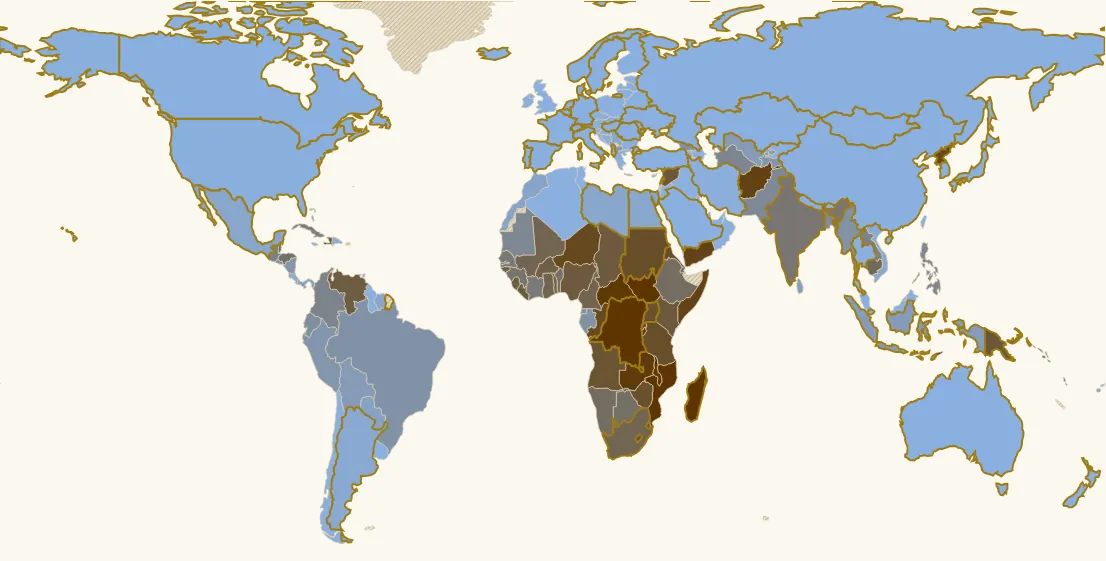
In 2024, 169 countries have a value. Highest: Madagascar (79 %), Congo - Kinshasa (74 %), Mozambique (72 %). Lowest: Taiwan (0 %), Trinidad & Tobago (0 %), Slovenia (0 %). World (population-weighted average): 9.3 %. France: < 0.1 % (135th of 169).
Country ranking in 2024
| Rank | Country | Value |
|---|---|---|
| 1 | Madagascar | 79 % |
| 2 | Congo - Kinshasa | 74 % |
| 3 | Mozambique | 72 % |
| 4 | South Sudan | 72 % |
| 5 | Malawi | 71 % |
| 6 | Central African Republic | 67 % |
| 7 | Zambia | 63 % |
| 8 | Burundi | 61 % |
| 9 | Afghanistan | 56 % |
| 10 | Somalia | 54 % |
| 11 | Yemen | 54 % |
| 12 | North Korea | 48 % |
| 13 | Niger | 46 % |
| 14 | Congo - Brazzaville | 45 % |
| 15 | Timor-Leste | 45 % |
| 16 | Eritrea | 41 % |
| 17 | Sudan | 41 % |
| 18 | Tanzania | 41 % |
| 19 | Rwanda | 39 % |
| 20 | Zimbabwe | 39 % |
| 21 | Uganda | 38 % |
| 22 | Angola | 36 % |
| 23 | Haiti | 36 % |
| 24 | Lesotho | 36 % |
| 25 | Papua New Guinea | 33 % |
| 26 | Kenya | 32 % |
| 27 | Solomon Islands | 32 % |
| 28 | Syria | 32 % |
| 29 | Nigeria | 31 % |
| 30 | Eswatini | 31 % |
| 31 | Chad | 31 % |
| 32 | Liberia | 29 % |
| 33 | Venezuela | 28 % |
| 34 | Burkina Faso | 25 % |
| 35 | Sierra Leone | 25 % |
| 36 | Guinea-Bissau | 24 % |
| 37 | Togo | 24 % |
| 38 | Cameroon | 22 % |
| 39 | Ghana | 22 % |
| 40 | Mali | 21 % |
| 41 | South Africa | 21 % |
| 42 | Belize | 20 % |
| 43 | Cambodia | 18 % |
| 44 | Djibouti | 16 % |
| 45 | Gambia | 16 % |
| 46 | Ethiopia | 15 % |
| 47 | Namibia | 15 % |
| 48 | Botswana | 13 % |
| 49 | Vanuatu | 13 % |
| 50 | Benin | 12 % |
| 51 | Honduras | 12 % |
| 52 | Guinea | 10 % |
| 53 | India its history → | 9.4 % |
| 54 | Senegal | 8.5 % |
| 55 | Côte d’Ivoire | 8.3 % |
| 56 | Cuba | 7.5 % |
| 57 | Guatemala | 6.6 % |
| 58 | Laos | 6 % |
| 59 | Colombia | 5.8 % |
| 60 | Turkmenistan | 5.4 % |
| 61 | Philippines | 5.2 % |
| 62 | Mauritania | 5.1 % |
| 63 | Pakistan | 4.7 % |
| 64 | Bangladesh | 4.3 % |
| 65 | Ecuador | 4 % |
| 66 | Georgia | 3.8 % |
| 67 | Myanmar (Burma) | 3.4 % |
| 68 | Brazil | 3.3 % |
| 69 | Gabon | 3.3 % |
| 70 | Equatorial Guinea | 3.3 % |
| 71 | El Salvador | 3.3 % |
| 72 | Nicaragua | 2.9 % |
| 73 | Peru | 2.8 % |
| 74 | Tajikistan | 2.8 % |
| 75 | North Macedonia | 2.4 % |
| 76 | Bolivia | 2.1 % |
| 77 | Uzbekistan | 2.1 % |
| 78 | Indonesia | 1.9 % |
| 79 | Sri Lanka | 1.8 % |
| 80 | Montenegro | 1.7 % |
| 81 | Panama | 1.6 % |
| 82 | Paraguay | 1.4 % |
| 83 | Morocco | 1.3 % |
| 84 | Egypt | 1.2 % |
| 85 | Fiji | 1.2 % |
| 86 | Libya | 1.2 % |
| 87 | Mexico | 1.2 % |
| 88 | Serbia | 1.2 % |
| 89 | Suriname | 1.1 % |
| 90 | Argentina its history → | 1 % |
| 91 | Costa Rica | 1 % |
| 92 | Vietnam | 0.9 % |
| 93 | Palestine | 0.7 % |
| 94 | Dominican Republic | 0.7 % |
| 95 | Iran | 0.6 % |
| 96 | Nepal | 0.6 % |
| 97 | Greece | 0.6 % |
| 98 | Armenia | 0.5 % |
| 99 | Bulgaria | 0.5 % |
| 100 | United States | 0.5 % |
| 101 | Australia its history → | 0.5 % |
| 102 | Hungary its history → | 0.4 % |
| 103 | Kyrgyzstan | 0.4 % |
| 104 | Jamaica | 0.4 % |
| 105 | Japan | 0.4 % |
| 106 | Austria | 0.4 % |
| 107 | Latvia | 0.4 % |
| 108 | Israel | 0.4 % |
| 109 | Türkiye | 0.3 % |
| 110 | Spain its history → | 0.3 % |
| 111 | Estonia | 0.3 % |
| 112 | Bahamas | 0.3 % |
| 113 | United Kingdom | 0.3 % |
| 114 | Croatia | 0.3 % |
| 115 | Italy | 0.3 % |
| 116 | Tunisia | 0.3 % |
| 117 | Chile | 0.3 % |
| 118 | Lithuania | 0.3 % |
| 119 | Canada | 0.2 % |
| 120 | Portugal its history → | 0.2 % |
| 121 | Sweden its history → | 0.2 % |
| 122 | Malta | 0.2 % |
| 123 | Iraq | 0.2 % |
| 124 | Mongolia | 0.2 % |
| 125 | Norway | 0.2 % |
| 126 | Russia | 0.2 % |
| 127 | Uruguay | 0.2 % |
| 128 | Denmark | 0.1 % |
| 129 | Oman | 0.1 % |
| 130 | Slovakia | 0.1 % |
| 131 | Poland | < 0.1 % |
| 132 | Germany its history → | < 0.1 % |
| 133 | Jordan | < 0.1 % |
| 134 | Netherlands its history → | < 0.1 % |
| 135 | France its history → | < 0.1 % |
| 136 | Ireland | < 0.1 % |
| 137 | Luxembourg | < 0.1 % |
| 138 | Bosnia & Herzegovina | < 0.1 % |
| 139 | Guyana | < 0.1 % |
| 140 | Belgium | < 0.1 % |
| 141 | Switzerland its history → | < 0.1 % |
| 142 | Czechia | < 0.1 % |
| 143 | Moldova | < 0.1 % |
| 144 | Ukraine its history → | < 0.1 % |
| 145 | Finland | < 0.1 % |
| 146 | Kazakhstan | < 0.1 % |
| 147 | South Korea | < 0.1 % |
| 148 | Cyprus | < 0.1 % |
| 149 | Saudi Arabia | < 0.1 % |
| 150 | Thailand | < 0.1 % |
| 151 | Albania | 0 % |
| 152 | United Arab Emirates | 0 % |
| 153 | Azerbaijan | 0 % |
| 154 | Belarus | 0 % |
| 155 | Brunei | 0 % |
| 156 | Bhutan | 0 % |
| 157 | China | 0 % |
| 158 | Algeria | 0 % |
| 159 | Iceland | 0 % |
| 160 | Kuwait | 0 % |
| 161 | Lebanon | 0 % |
| 162 | Malaysia | 0 % |
| 163 | New Zealand | 0 % |
| 164 | Qatar | 0 % |
| 165 | Romania | 0 % |
| 166 | Singapore | 0 % |
| 167 | Slovenia | 0 % |
| 168 | Trinidad & Tobago | 0 % |
| 169 | Taiwan | 0 % |
9 countries or territories have no value that year.
Continent averages
| World (population-weighted average) | 9.3 % |
| Europe (average) | 0.2 % |
| Africa (average) | 31 % |
| Americas (average) | 3.1 % |
| Asia (average) | 5.2 % |
| Oceania (average) | 8.8 % |
Understanding this map
Four lines, four questions
The first three lines are absolute: the same amount, adjusted for the cost of living, everywhere and at any time. $2.15 a day measures destitution (hunger, no decent housing); $3.65 and $6.85 are the lines the World Bank considers suited to middle-income countries, where $2.15 is no longer enough to live decently. The fourth is relative: it counts those who are much poorer than their fellow citizens, whatever the country's standard of living. It answers another question: who is shut out of their country's ordinary way of life?
Two centuries of decline
According to Gapminder's estimates, about 80% of humanity lived below $2.15 a day in 1800, still two thirds in 1900 and over 40% in 1980; it is under 10% today. The most spectacular decline is China's (about 90% in 1980, almost no one today), followed by India and Bangladesh. With the $6.85 line the picture is less rosy: 44% of humanity still lives below it, including three quarters of Indians and 14% of Chinese. Extreme poverty is now concentrated in sub-Saharan Africa: Madagascar, DR Congo, South Sudan, Mozambique and Malawi have more than two thirds of their people below it.
The relative line: a measure of inequality
On the relative line, Denmark (11%), Czechia and Finland do best, France is around 16%, Italy and Spain about 22%, the United States 25%. But India is only at 14%: not because destitution is rare there (45% of Indians live below $3.65), but because most people have incomes close to the median. This line therefore says how far the bottom of the ladder falls behind the middle, not how many people lack the essentials. For France, the World Bank counts slightly more poor people than Insee (about 14 to 15%): it divides household income by the number of people, while Insee allows for the savings of living together (a couple does not need two homes).
Limits
The $2.15 and $6.85 series go back to 1800: before the first surveys (around 1980 in most countries) they are Gapminder reconstructions from GDP per person and estimated inequality, orders of magnitude; the latest years are estimates. The $3.65 and relative views come directly from World Bank surveys (1980-2021): between two surveys at most ten years apart the value is interpolated, and the tooltip gives the year of the latest. Many poor countries measure consumption rather than income. The World Bank raised its lines in 2025 ($3, $4.20 and $8.30, 2021 prices); these series keep the old ones. For the relative line, world and continents are country medians.
Sources : Gapminder, extrême pauvreté, série longue (CC BY 4.0)
In the same theme : Inequality
All maps
Page updated on 2026-11-03.