Children per woman
Average number of children a woman would have over her lifetime at that year's fertility.
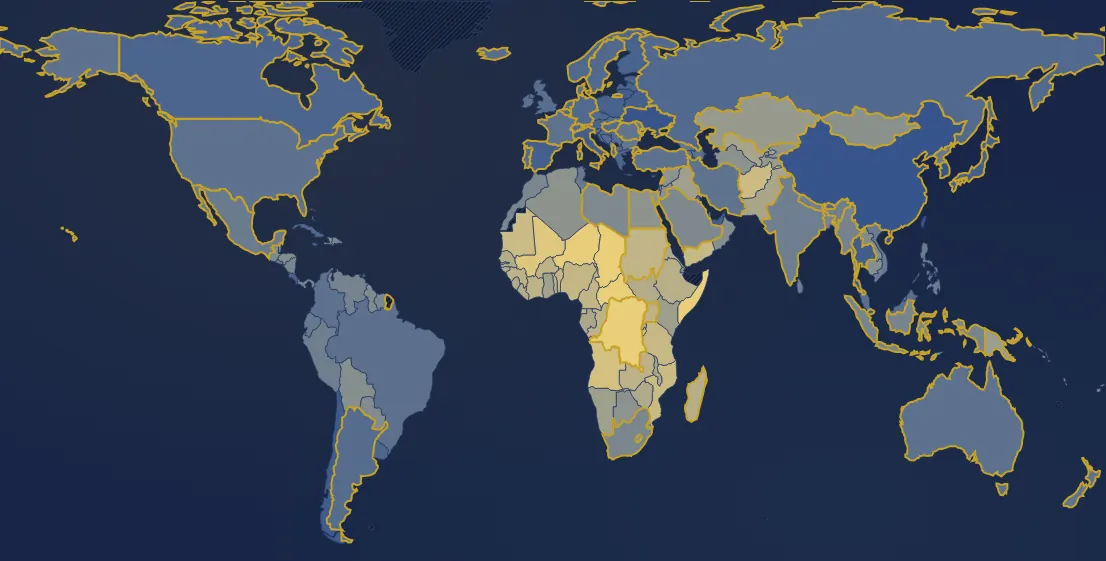
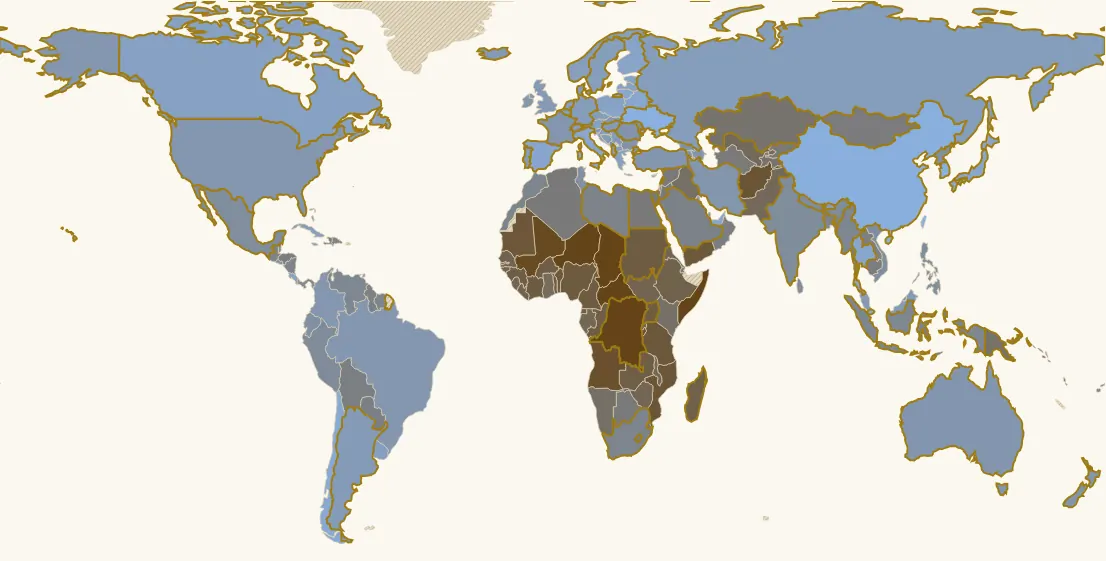
In 2024, 169 countries have a value. Highest: Chad (6), Somalia (6), Congo - Kinshasa (6). Lowest: South Korea (0.7), Taiwan (0.9), Singapore (1). World (population-weighted average): 2.2. France: 1.6 (111th of 169).
Country ranking in 2024
| Rank | Country | Value |
|---|---|---|
| 1 | Chad | 6 |
| 2 | Somalia | 6 |
| 3 | Congo - Kinshasa | 6 |
| 4 | Central African Republic | 6 |
| 5 | Niger | 5.9 |
| 6 | Mali | 5.5 |
| 7 | Angola | 5.1 |
| 8 | Burundi | 4.8 |
| 9 | Afghanistan | 4.8 |
| 10 | Mozambique | 4.7 |
| 11 | Mauritania | 4.6 |
| 12 | Tanzania | 4.5 |
| 13 | Yemen | 4.5 |
| 14 | Benin | 4.5 |
| 15 | Nigeria | 4.4 |
| 16 | Cameroon | 4.3 |
| 17 | Sudan | 4.3 |
| 18 | Côte d’Ivoire | 4.2 |
| 19 | Uganda | 4.2 |
| 20 | Guinea | 4.1 |
| 21 | Equatorial Guinea | 4.1 |
| 22 | Togo | 4.1 |
| 23 | Burkina Faso | 4.1 |
| 24 | Congo - Brazzaville | 4.1 |
| 25 | Zambia | 4 |
| 26 | Ethiopia | 3.9 |
| 27 | Gambia | 3.9 |
| 28 | Madagascar | 3.9 |
| 29 | Liberia | 3.9 |
| 30 | South Sudan | 3.8 |
| 31 | Senegal | 3.8 |
| 32 | Guinea-Bissau | 3.8 |
| 33 | Sierra Leone | 3.7 |
| 34 | Eritrea | 3.7 |
| 35 | Zimbabwe | 3.7 |
| 36 | Rwanda | 3.7 |
| 37 | Gabon | 3.6 |
| 38 | Malawi | 3.6 |
| 39 | Vanuatu | 3.6 |
| 40 | Pakistan | 3.6 |
| 41 | Solomon Islands | 3.5 |
| 42 | Uzbekistan | 3.5 |
| 43 | Ghana | 3.3 |
| 44 | Palestine | 3.3 |
| 45 | Iraq | 3.2 |
| 46 | Namibia | 3.2 |
| 47 | Kenya | 3.2 |
| 48 | Papua New Guinea | 3.1 |
| 49 | Tajikistan | 3 |
| 50 | Kazakhstan | 3 |
| 51 | Israel | 2.8 |
| 52 | Kyrgyzstan | 2.8 |
| 53 | Egypt | 2.7 |
| 54 | Algeria | 2.7 |
| 55 | Eswatini | 2.7 |
| 56 | Botswana | 2.7 |
| 57 | Syria | 2.7 |
| 58 | Lesotho | 2.7 |
| 59 | Turkmenistan | 2.7 |
| 60 | Haiti | 2.6 |
| 61 | Mongolia | 2.6 |
| 62 | Timor-Leste | 2.6 |
| 63 | Djibouti | 2.6 |
| 64 | Jordan | 2.6 |
| 65 | Cambodia | 2.6 |
| 66 | Bolivia | 2.5 |
| 67 | Oman | 2.5 |
| 68 | Honduras | 2.5 |
| 69 | Paraguay | 2.4 |
| 70 | Guyana | 2.4 |
| 71 | Laos | 2.4 |
| 72 | Saudi Arabia | 2.3 |
| 73 | Libya | 2.3 |
| 74 | Guatemala | 2.3 |
| 75 | Fiji | 2.3 |
| 76 | Lebanon | 2.2 |
| 77 | Suriname | 2.2 |
| 78 | Dominican Republic | 2.2 |
| 79 | Morocco | 2.2 |
| 80 | Nicaragua | 2.2 |
| 81 | South Africa | 2.2 |
| 82 | Bangladesh | 2.1 |
| 83 | Indonesia | 2.1 |
| 84 | Panama | 2.1 |
| 85 | Myanmar (Burma) | 2.1 |
| 86 | Venezuela | 2.1 |
| 87 | Belize | 2 |
| 88 | Peru | 2 |
| 89 | India its history → | 2 |
| 90 | Nepal | 2 |
| 91 | Sri Lanka | 2 |
| 92 | Vietnam | 1.9 |
| 93 | Mexico | 1.9 |
| 94 | Philippines | 1.9 |
| 95 | Tunisia | 1.8 |
| 96 | Ecuador | 1.8 |
| 97 | Georgia | 1.8 |
| 98 | Montenegro | 1.8 |
| 99 | North Korea | 1.8 |
| 100 | El Salvador | 1.8 |
| 101 | Bulgaria | 1.8 |
| 102 | Brunei | 1.7 |
| 103 | Moldova | 1.7 |
| 104 | Armenia | 1.7 |
| 105 | Qatar | 1.7 |
| 106 | Romania | 1.7 |
| 107 | Iran | 1.7 |
| 108 | Azerbaijan | 1.7 |
| 109 | New Zealand | 1.7 |
| 110 | Australia its history → | 1.6 |
| 111 | France its history → | 1.6 |
| 112 | Colombia | 1.6 |
| 113 | Türkiye | 1.6 |
| 114 | United States | 1.6 |
| 115 | Brazil | 1.6 |
| 116 | Ireland | 1.6 |
| 117 | Slovenia | 1.6 |
| 118 | Slovakia | 1.6 |
| 119 | United Kingdom | 1.6 |
| 120 | Malaysia | 1.5 |
| 121 | Trinidad & Tobago | 1.5 |
| 122 | Denmark | 1.5 |
| 123 | Iceland | 1.5 |
| 124 | Kuwait | 1.5 |
| 125 | Portugal its history → | 1.5 |
| 126 | Argentina its history → | 1.5 |
| 127 | Serbia | 1.5 |
| 128 | Bosnia & Herzegovina | 1.5 |
| 129 | Hungary its history → | 1.5 |
| 130 | Croatia | 1.5 |
| 131 | North Macedonia | 1.5 |
| 132 | Czechia | 1.5 |
| 133 | Russia | 1.5 |
| 134 | Bhutan | 1.5 |
| 135 | Cuba | 1.5 |
| 136 | Germany its history → | 1.5 |
| 137 | Switzerland its history → | 1.4 |
| 138 | Netherlands its history → | 1.4 |
| 139 | Sweden its history → | 1.4 |
| 140 | Norway | 1.4 |
| 141 | Luxembourg | 1.4 |
| 142 | Uruguay | 1.4 |
| 143 | Belgium | 1.4 |
| 144 | Cyprus | 1.4 |
| 145 | Bahamas | 1.4 |
| 146 | Estonia | 1.4 |
| 147 | Jamaica | 1.4 |
| 148 | Albania | 1.3 |
| 149 | Canada | 1.3 |
| 150 | Greece | 1.3 |
| 151 | Latvia | 1.3 |
| 152 | Austria | 1.3 |
| 153 | Costa Rica | 1.3 |
| 154 | Poland | 1.3 |
| 155 | Finland | 1.3 |
| 156 | Belarus | 1.2 |
| 157 | Spain its history → | 1.2 |
| 158 | Japan | 1.2 |
| 159 | United Arab Emirates | 1.2 |
| 160 | Italy | 1.2 |
| 161 | Lithuania | 1.2 |
| 162 | Thailand | 1.2 |
| 163 | Chile | 1.1 |
| 164 | Malta | 1.1 |
| 165 | China | 1 |
| 166 | Ukraine its history → | 1 |
| 167 | Singapore | 1 |
| 168 | Taiwan | 0.9 |
| 169 | South Korea | 0.7 |
9 countries or territories have no value that year.
Continent averages
| World (population-weighted average) | 2.2 |
| Europe (average) | 1.4 |
| Africa (average) | 4.1 |
| Americas (average) | 1.7 |
| Asia (average) | 1.8 |
| Oceania (average) | 2 |
Understanding this map
Definition
This is the “total fertility rate”: the birth rates of every age (15 to 49) observed in a single year, added up. It does not count the children of a real generation, but those of an imaginary woman living her whole life under that year's conditions.
The 2.1 threshold
At around 2.1 children per woman, each generation roughly replaces the previous one (a bit over 2, because some children die before adulthood). Below it, the population eventually shrinks without immigration.
The demographic transition
Everywhere, mortality falls first and fertility afterwards: in between, population booms. France is an early exception (decline from the late 18th century); South Korea goes from 6 children to 1 in half a century.
Sources : Gapminder (CC BY 4.0), d’après ONU, HMD, Maddison et autres
All maps
Page updated on 2026-11-03.