10-year government borrowing rate
The interest rate at which the state borrows for ten years (yield on its bonds, yearly average): what each new loan costs it.
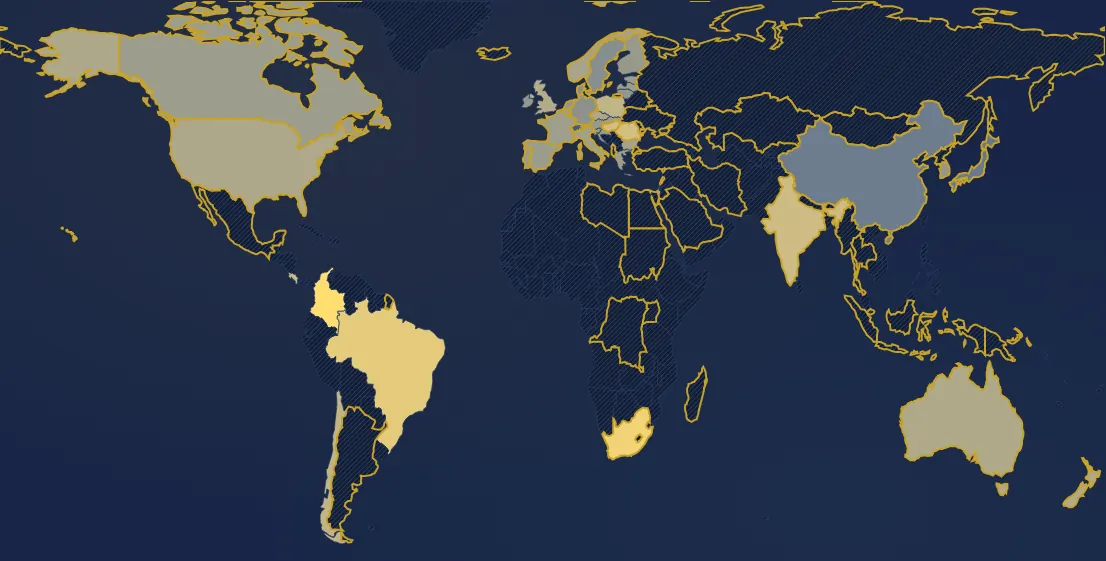
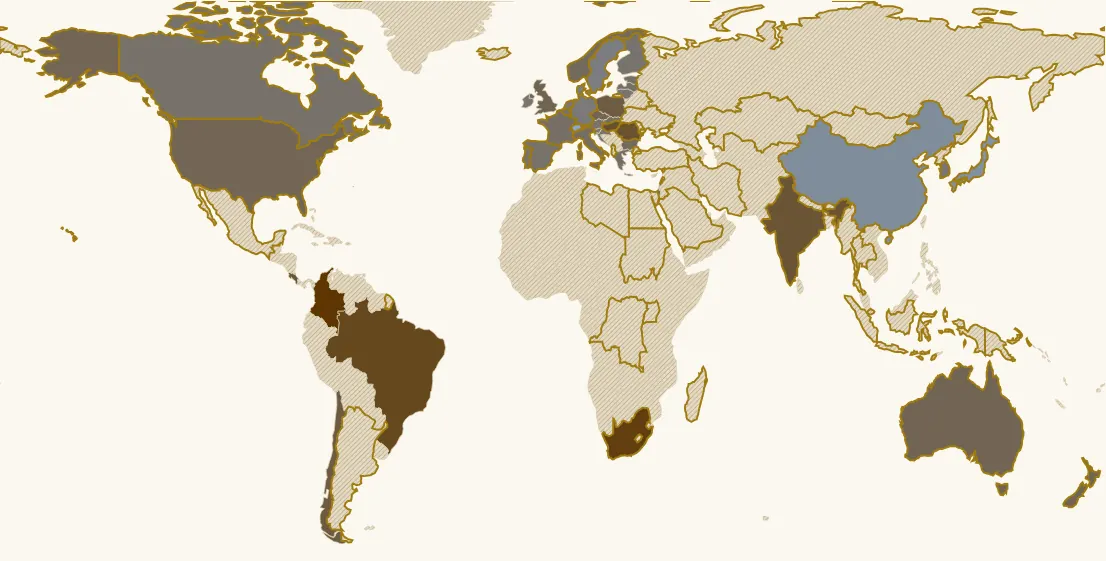
In 2025, 42 countries have a value. Highest: Colombia (12.44 %), South Africa (10.23 %), Brazil (8.66 %). Lowest: Switzerland (0.32 %), Japan (1.55 %), China (1.75 %). France: 3.37 % (21st of 42).
Country ranking in 2025
| Rank | Country | Value |
|---|---|---|
| 1 | Colombia | 12.44 % |
| 2 | South Africa | 10.23 % |
| 3 | Brazil | 8.66 % |
| 4 | Romania | 6.94 % |
| 5 | Hungary its history → | 6.93 % |
| 6 | Costa Rica | 6.55 % |
| 7 | India its history → | 6.53 % |
| 8 | Chile | 5.68 % |
| 9 | Poland | 5.5 % |
| 10 | United Kingdom | 4.58 % |
| 11 | New Zealand | 4.47 % |
| 12 | Australia its history → | 4.37 % |
| 13 | Czechia | 4.31 % |
| 14 | United States | 4.29 % |
| 15 | Israel | 4.24 % |
| 16 | Norway | 3.94 % |
| 17 | Bulgaria | 3.93 % |
| 18 | Italy | 3.59 % |
| 19 | Slovakia | 3.43 % |
| 20 | Greece | 3.38 % |
| 21 | France its history → | 3.37 % |
| 22 | Estonia | 3.32 % |
| 23 | Latvia | 3.3 % |
| 24 | Canada | 3.23 % |
| 25 | Spain its history → | 3.22 % |
| 26 | Belgium | 3.19 % |
| 27 | Slovenia | 3.11 % |
| 28 | Portugal its history → | 3.08 % |
| 29 | Finland | 3.01 % |
| 30 | Croatia | 3 % |
| 31 | Austria | 2.99 % |
| 32 | Luxembourg | 2.92 % |
| 33 | Ireland | 2.9 % |
| 34 | South Korea | 2.89 % |
| 35 | Lithuania | 2.88 % |
| 36 | Netherlands its history → | 2.81 % |
| 37 | Germany its history → | 2.61 % |
| 38 | Sweden its history → | 2.48 % |
| 39 | Denmark | 2.47 % |
| 40 | China | 1.75 % |
| 41 | Japan | 1.55 % |
| 42 | Switzerland its history → | 0.32 % |
136 countries or territories have no value that year.
Continent averages
| Europe (median of countries) | 3.21 % |
| Americas (median of countries) | 6.12 % |
| Asia (median of countries) | 2.89 % |
Understanding this map
What this figure measures
To borrow, the state sells bonds: securities that pay interest each year and are repaid after ten years. The rate at which investors agree to buy them depends on their confidence in the country, expected inflation and central bank policy. It is the cost of each new loan; the “interest” view shows the average cost of all accumulated debt, which follows several years behind.
A century and a half of rates
In the 19th century, under the gold standard, the major states borrowed at 3-5%. The inflation of the 1970s sent rates soaring: 16% in France in 1981, 19% in Italy. They then fell for forty years, turning negative around 2020 in Germany, Switzerland and Japan: investors paid to lend to these states. During the euro-area crisis Greece borrowed at over 22% (2012) and Portugal at over 10%. Since 2022 returning inflation has pushed rates up again: France borrows at around 3% in 2024-2025.
The real rate
A 10% rate with 12% inflation costs less than a 3% rate without inflation: rising prices erode the value of what the state must repay. In the 1970s, and again in 2021-2022, real rates are negative almost everywhere, and debt melts. In the 1980s-1990s, by contrast, real rates reach 4 to 7% in Europe, which makes debt much heavier. During wars and hyperinflations (Germany 1923-1924, Japan 1945-1947), the real rate falls to −50 to −90%: the debt is practically wiped out, and savers who had lent to the state are ruined. Formula: (1 + rate) / (1 + inflation) − 1, which cannot go below −100%.
Limits
The OECD mainly covers rich countries and a few emerging ones (Mexico, Colombia, Brazil, India, China, South Africa…), often only since the 1990s. Before its first data, the map uses the Macrohistory Database for 18 rich countries since 1870. Many poor countries do not issue 10-year bonds in their own currency: they borrow in dollars or from international institutions, and do not appear here. The real rate uses the same year's inflation, not the inflation lenders expected.
In the same theme : Public finances
All maps
Page updated on 2026-11-03.