Gender gap in hourly wages
Difference between men's and women's average hourly earnings, as a % of men's earnings. A positive value means men earn more on average, a negative value that women earn more. For equal working time, but without accounting for occupation or job held.
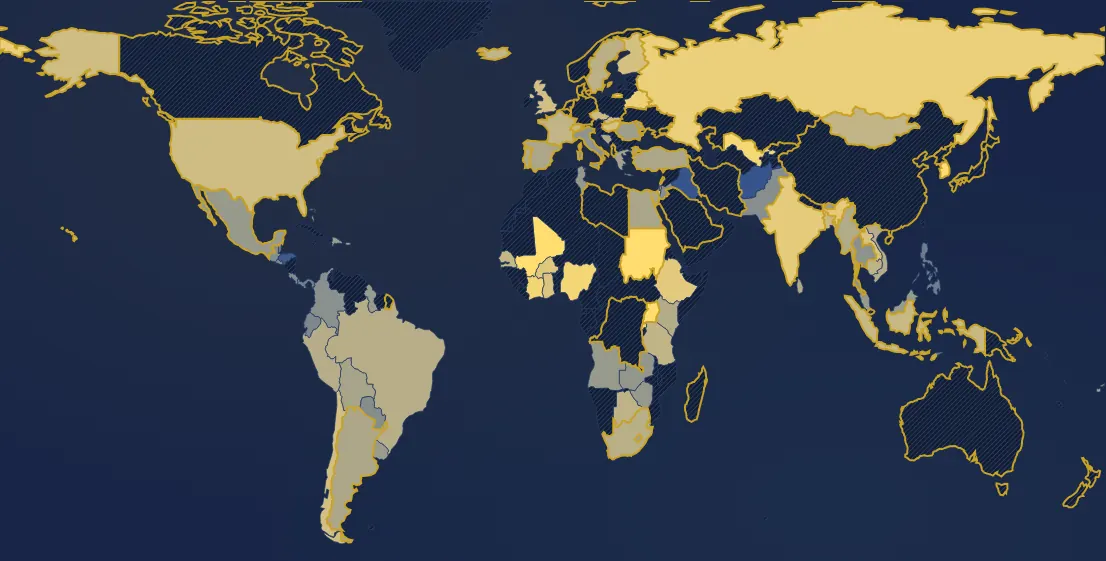
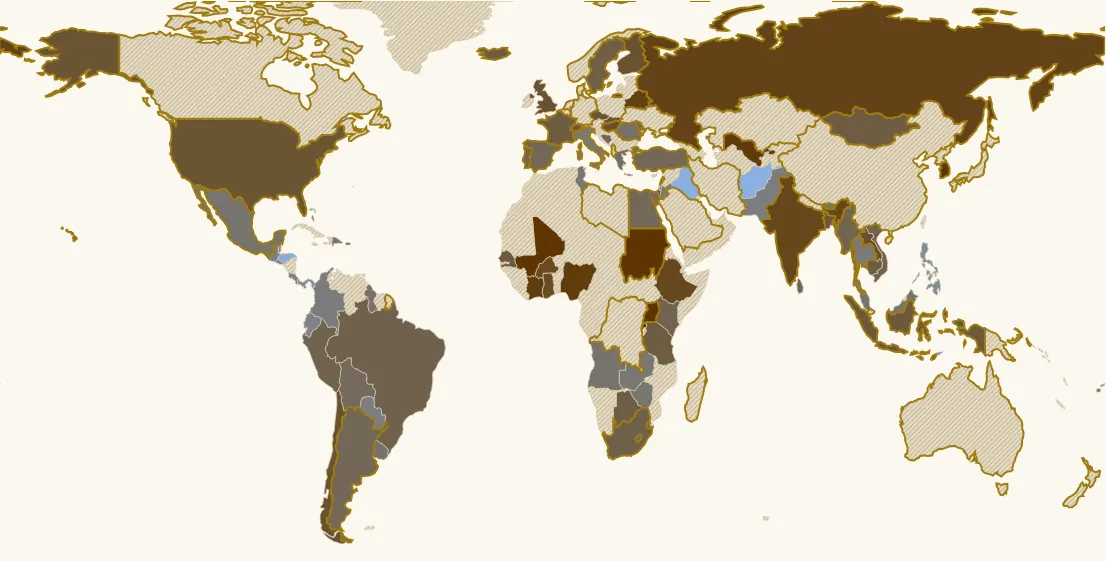
In 2024, 85 countries have a value. Highest: Sudan (+63 %), Uganda (+48 %), Mali (+42 %). Lowest: Afghanistan (−125 %), Iraq (−66 %), Lebanon (−36 %). France: +12 % (31st of 85).
Country ranking in 2024
| Rank | Country | Value |
|---|---|---|
| 1 | Sudan | +63 % |
| 2 | Uganda | +48 % |
| 3 | Mali | +42 % |
| 4 | South Korea | +29 % |
| 5 | Uzbekistan | +27 % |
| 6 | Côte d’Ivoire | +27 % |
| 7 | Nigeria | +27 % |
| 8 | Rwanda | +25 % |
| 9 | Belarus | +25 % |
| 10 | Russia | +24 % |
| 11 | India its history → | +22 % |
| 12 | Ethiopia | +21 % |
| 13 | Burkina Faso | +20 % |
| 14 | Ghana | +19 % |
| 15 | Israel | +19 % |
| 16 | Laos | +18 % |
| 17 | Hungary its history → | +18 % |
| 18 | Finland | +17 % |
| 19 | Chile | +16 % |
| 20 | United Kingdom | +16 % |
| 21 | Slovakia | +15 % |
| 22 | United States | +15 % |
| 23 | Czechia | +15 % |
| 24 | Bangladesh | +15 % |
| 25 | Indonesia | +14 % |
| 26 | Switzerland its history → | +13 % |
| 27 | Palestine | +13 % |
| 28 | Senegal | +13 % |
| 29 | Mongolia | +12 % |
| 30 | Iceland | +12 % |
| 31 | France its history → | +12 % |
| 32 | Tanzania | +11 % |
| 33 | Cambodia | +11 % |
| 34 | Botswana | +11 % |
| 35 | Sweden its history → | +9.9 % |
| 36 | South Africa | +9.5 % |
| 37 | Brazil | +8.8 % |
| 38 | Vietnam | +8.7 % |
| 39 | Peru | +8.4 % |
| 40 | Kenya | +8.1 % |
| 41 | Puerto Rico | +7.5 % |
| 42 | Myanmar (Burma) | +7.2 % |
| 43 | Portugal its history → | +7.2 % |
| 44 | Sri Lanka | +7 % |
| 45 | Eswatini | +6.4 % |
| 46 | Bosnia & Herzegovina | +6.3 % |
| 47 | Argentina its history → | +5.9 % |
| 48 | Spain its history → | +5.9 % |
| 49 | Türkiye | +5.9 % |
| 50 | Egypt | +5.4 % |
| 51 | Bolivia | +4.4 % |
| 52 | Lesotho | +3.8 % |
| 53 | Greece | +3.5 % |
| 54 | Moldova | +2.9 % |
| 55 | Fiji | +1.5 % |
| 56 | Romania | +1.3 % |
| 57 | Uruguay | +0.9 % |
| 58 | Dominican Republic | +0.5 % |
| 59 | Guyana | +0.3 % |
| 60 | Angola | 0 % |
| 61 | Mexico | 0 % |
| 62 | Malaysia | 0 % |
| 63 | Bhutan | −0.6 % |
| 64 | Zimbabwe | −0.8 % |
| 65 | Tunisia | −0.9 % |
| 66 | Zambia | −1.6 % |
| 67 | Bahamas | −2.1 % |
| 68 | Italy | −2.5 % |
| 69 | Thailand | −3.6 % |
| 70 | Colombia | −4.5 % |
| 71 | Jordan | −4.7 % |
| 72 | Pakistan | −5.1 % |
| 73 | Guatemala | −5.3 % |
| 74 | Paraguay | −5.5 % |
| 75 | Costa Rica | −6.3 % |
| 76 | El Salvador | −7.1 % |
| 77 | Ecuador | −8.3 % |
| 78 | Belize | −11 % |
| 79 | Panama | −12 % |
| 80 | Philippines | −13 % |
| 81 | Timor-Leste | −17 % |
| 82 | Honduras | −28 % |
| 83 | Lebanon | −36 % |
| 84 | Iraq | −66 % |
| 85 | Afghanistan | −125 % |
93 countries or territories have no value that year.
Continent averages
| Europe (median of countries) | +12 % |
| Africa (median of countries) | +11 % |
| Americas (median of countries) | 0 % |
| Asia (median of countries) | +7.2 % |
Understanding this map
Three gaps, three questions
Very different figures get quoted because they answer different questions. Insee computed all three for France (private sector, 2023); each level removes part of the gap and shows what remains.
1. Over the year: 22.2%
This is the gap in income actually received over the year. It is first explained by the number of paid hours: women work part-time more often (frequently to look after children) and are more often out of work for part of the year.
2. For equal working time: 14.2%
Once wages are converted to full-time, the remaining gap mostly reflects the fact that women and men do not hold the same occupations or positions: women are more numerous in lower-paid occupations and sectors (care, education, services) and less present in the best-paid positions. This is not only a matter of individual choice: education paths, the division of family tasks and slower careers after childbirth weigh heavily. This is the level the map shows, because it is the only one measured on a comparable basis in around a hundred countries.
3. For a comparable job: 3.8%
Comparing women and men in the same kind of job in the same workplace, the gap falls to 3.8%. This remainder is not explained by the characteristics measured. Several explanations are put forward and debated: bonuses, seniority or responsibilities poorly measured, differences in pay negotiation, and discrimination. Insee stresses that this figure does not, on its own, measure discrimination, and that it covers only about 40% of private-sector jobs. This level is not on the map: it requires very detailed data linking each employee to their job and workplace, which few countries produce, each with its own method. There is therefore no comparable worldwide series.
None is “the true” figure
Each answers its own question. Using 22% to talk about “unequal pay for equal work” is wrong; using 4% to say the gap has disappeared is wrong too, since most of it lies in working time and the jobs held.
When women earn more
In some countries (Afghanistan, Iraq, Lebanon, Honduras, the Philippines…), women's average hourly wage exceeds men's. This is no sign of equality achieved, rather the opposite: where few women hold paid jobs, those who do are often educated, urban, working as teachers, nurses or civil servants, while men in paid work include many low-paid labourers. Two very different populations are then being compared. Self-employed and informal workers, who include many women in these countries, are not counted, and surveys sometimes rest on small samples (hence extreme values such as −125% for Afghanistan in 2020).
Limits
The data (International Labour Organization) come from different national surveys, and many countries have only a few years: the map carries the last known value for up to five years, and the tooltip says so. Some large countries (Germany, Japan, China) are missing from this series. There is no world average; a continent's line is the median of the countries available each year.
All maps
Page updated on 2026-11-03.