Income share of the richest 10%
The share of national income going to the best-paid 10% of adults, before taxes and social benefits. 10% would mean perfect equality.
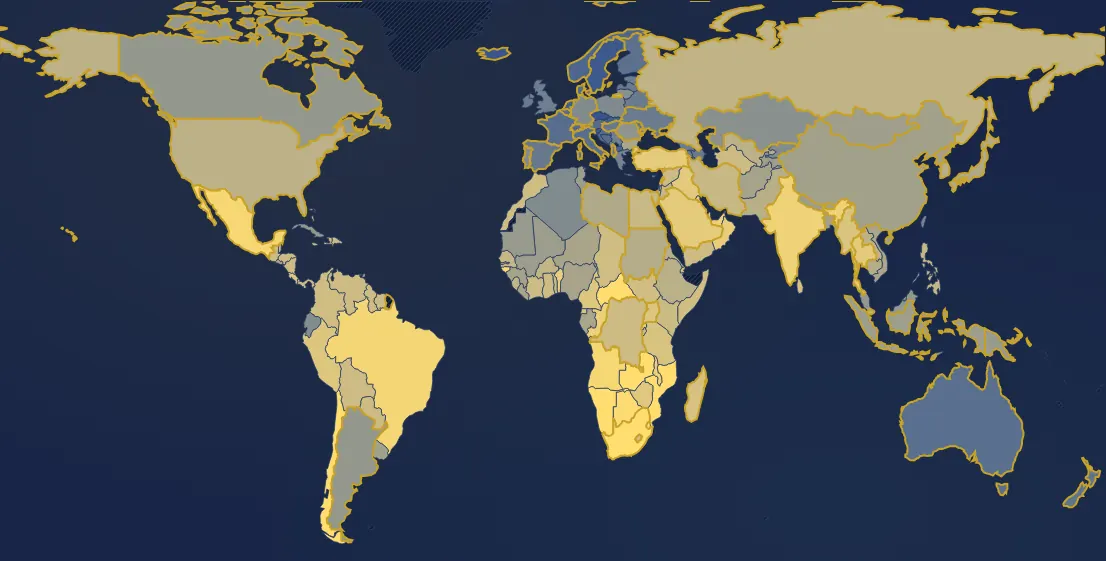
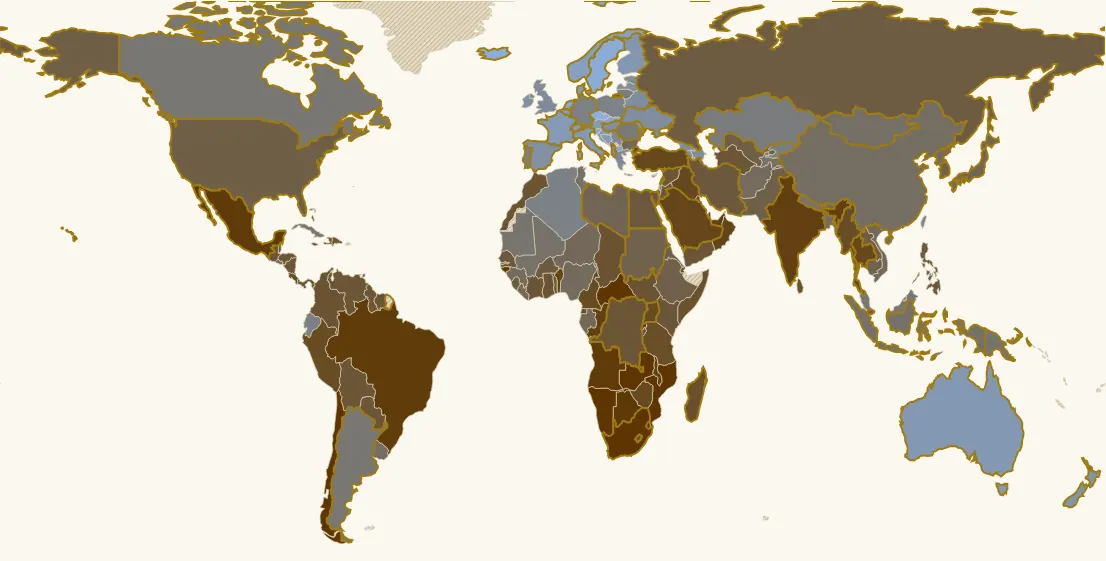
In 2019, 166 countries have a value. Highest: South Africa (65.1 %), Central African Republic (64.6 %), Mozambique (64.2 %). Lowest: Czechia (28 %), Iceland (28.4 %), Sweden (28.8 %). World (population-weighted average): 46.6 %. France: 32.1 % (154th of 166).
Country ranking in 2019
| Rank | Country | Value |
|---|---|---|
| 1 | South Africa | 65.1 % |
| 2 | Central African Republic | 64.6 % |
| 3 | Mozambique | 64.2 % |
| 4 | Namibia | 64 % |
| 5 | Zambia | 61.5 % |
| 6 | Chile | 60.2 % |
| 7 | Guinea-Bissau | 59.7 % |
| 8 | Eswatini | 59.5 % |
| 9 | Botswana | 58.9 % |
| 10 | Mexico | 58 % |
| 11 | Angola | 57.7 % |
| 12 | Brazil | 57.3 % |
| 13 | Lebanon | 57.1 % |
| 14 | India its history → | 56.1 % |
| 15 | United Arab Emirates | 55.8 % |
| 16 | Malawi | 55.8 % |
| 17 | Congo - Brazzaville | 55.6 % |
| 18 | Benin | 54.7 % |
| 19 | Oman | 54.3 % |
| 20 | Saudi Arabia | 53.6 % |
| 21 | Rwanda | 53.4 % |
| 22 | Türkiye | 53.3 % |
| 23 | Kuwait | 53.2 % |
| 24 | Thailand | 53.1 % |
| 25 | Iraq | 52.9 % |
| 26 | Qatar | 52.6 % |
| 27 | Zimbabwe | 52 % |
| 28 | Cameroon | 51.7 % |
| 29 | Costa Rica | 51.6 % |
| 30 | Peru | 51.6 % |
| 31 | Uganda | 51.5 % |
| 32 | Equatorial Guinea | 51.3 % |
| 33 | Myanmar (Burma) | 50.9 % |
| 34 | Tanzania | 50.7 % |
| 35 | Madagascar | 50.3 % |
| 36 | Palestine | 50.3 % |
| 37 | Somalia | 49.3 % |
| 38 | Djibouti | 49.1 % |
| 39 | Sri Lanka | 49.1 % |
| 40 | Lesotho | 49.1 % |
| 41 | South Sudan | 49.1 % |
| 42 | Colombia | 48.9 % |
| 43 | Chad | 48.9 % |
| 44 | Morocco | 48.8 % |
| 45 | Ghana | 48.6 % |
| 46 | Bahamas | 48.5 % |
| 47 | Belize | 48.5 % |
| 48 | Bolivia | 48.5 % |
| 49 | Dominican Republic | 48.5 % |
| 50 | Guatemala | 48.5 % |
| 51 | Guyana | 48.5 % |
| 52 | Honduras | 48.5 % |
| 53 | Haiti | 48.5 % |
| 54 | Jamaica | 48.5 % |
| 55 | Nicaragua | 48.5 % |
| 56 | Panama | 48.5 % |
| 57 | Paraguay | 48.5 % |
| 58 | Suriname | 48.5 % |
| 59 | Trinidad & Tobago | 48.5 % |
| 60 | Venezuela | 48.5 % |
| 61 | Congo - Kinshasa | 48.4 % |
| 62 | Turkmenistan | 48.4 % |
| 63 | Yemen | 48.4 % |
| 64 | Côte d’Ivoire | 48.3 % |
| 65 | Kenya | 48.2 % |
| 66 | Syria | 48.1 % |
| 67 | Burundi | 47.8 % |
| 68 | Togo | 47.6 % |
| 69 | Egypt | 47.3 % |
| 70 | Iran | 47.3 % |
| 71 | Senegal | 47.2 % |
| 72 | Jordan | 47.1 % |
| 73 | Philippines | 46.8 % |
| 74 | Burkina Faso | 46.4 % |
| 75 | Israel | 46.3 % |
| 76 | Sierra Leone | 46.2 % |
| 77 | Russia | 46 % |
| 78 | Laos | 45.7 % |
| 79 | United States | 45.4 % |
| 80 | Gambia | 45.2 % |
| 81 | Singapore | 45.2 % |
| 82 | Uzbekistan | 45.2 % |
| 83 | Eritrea | 44.9 % |
| 84 | Ethiopia | 44.9 % |
| 85 | South Korea | 44.9 % |
| 86 | Pakistan | 44.7 % |
| 87 | Sudan | 44.3 % |
| 88 | Cambodia | 44.2 % |
| 89 | Libya | 43.4 % |
| 90 | Japan | 43.3 % |
| 91 | Gabon | 42.8 % |
| 92 | Bulgaria | 42.7 % |
| 93 | Vietnam | 42.7 % |
| 94 | Liberia | 42.6 % |
| 95 | Niger | 42.6 % |
| 96 | Nigeria | 42.1 % |
| 97 | North Korea | 42.1 % |
| 98 | Afghanistan | 42 % |
| 99 | Bhutan | 42 % |
| 100 | Guinea | 42 % |
| 101 | El Salvador | 42 % |
| 102 | Bangladesh | 41.8 % |
| 103 | Uruguay | 41.6 % |
| 104 | China | 41.4 % |
| 105 | Mongolia | 41 % |
| 106 | Tajikistan | 40.8 % |
| 107 | Indonesia | 40.7 % |
| 108 | Tunisia | 40.7 % |
| 109 | Mali | 40.6 % |
| 110 | Nepal | 40.4 % |
| 111 | Papua New Guinea | 40.1 % |
| 112 | Mauritania | 39.9 % |
| 113 | Argentina its history → | 39.5 % |
| 114 | Cuba | 39.5 % |
| 115 | Brunei | 39.4 % |
| 116 | Canada | 39.4 % |
| 117 | Malaysia | 39.4 % |
| 118 | Timor-Leste | 39.4 % |
| 119 | Romania | 38.9 % |
| 120 | Kazakhstan | 38.2 % |
| 121 | Lithuania | 38.2 % |
| 122 | Kyrgyzstan | 37.6 % |
| 123 | Ecuador | 37.5 % |
| 124 | Portugal its history → | 37.4 % |
| 125 | Germany its history → | 37.3 % |
| 126 | Algeria | 37.3 % |
| 127 | Poland | 37.1 % |
| 128 | Greece | 36.1 % |
| 129 | Montenegro | 36.1 % |
| 130 | Taiwan | 36 % |
| 131 | Serbia | 35.3 % |
| 132 | United Kingdom | 35.2 % |
| 133 | Cyprus | 35.1 % |
| 134 | Estonia | 34.8 % |
| 135 | Armenia | 34.5 % |
| 136 | Azerbaijan | 34.5 % |
| 137 | Belarus | 34.5 % |
| 138 | Georgia | 34.5 % |
| 139 | Ukraine its history → | 34.5 % |
| 140 | Ireland | 34.4 % |
| 141 | Latvia | 34.4 % |
| 142 | Spain its history → | 34.2 % |
| 143 | Hungary its history → | 34.2 % |
| 144 | Albania | 34 % |
| 145 | Malta | 33.5 % |
| 146 | Moldova | 33.4 % |
| 147 | New Zealand | 33.3 % |
| 148 | Luxembourg | 32.8 % |
| 149 | Finland | 32.7 % |
| 150 | Australia its history → | 32.5 % |
| 151 | Italy | 32.3 % |
| 152 | Bosnia & Herzegovina | 32.2 % |
| 153 | Croatia | 32.2 % |
| 154 | France its history → | 32.1 % |
| 155 | Austria | 32 % |
| 156 | Switzerland its history → | 31.9 % |
| 157 | Belgium | 31.7 % |
| 158 | Denmark | 31.7 % |
| 159 | Norway | 30.9 % |
| 160 | North Macedonia | 30.5 % |
| 161 | Netherlands its history → | 29.5 % |
| 162 | Slovakia | 29.5 % |
| 163 | Slovenia | 29.4 % |
| 164 | Sweden its history → | 28.8 % |
| 165 | Iceland | 28.4 % |
| 166 | Czechia | 28 % |
12 countries or territories have no value that year.
Continent averages
| World (population-weighted average) | 46.6 % |
| Europe (average) | 38.2 % |
| Africa (average) | 48.3 % |
| Americas (average) | 49.7 % |
| Asia (average) | 47.1 % |
| Oceania (average) | 34.4 % |
Understanding this map
What this figure measures
The World Inequality Database (Piketty, Chancel, Saez, Zucman and others) combines surveys, tax returns and national accounts, which captures very high incomes and capital income (dividends, interest, rents) better than surveys alone. The figure is before taxes: it shows how the economy distributes income, before the state redistributes.
Since 1980
The share of the richest 10% has risen almost everywhere, but not at the same pace: in the United States, from 34% in 1980 to 45% in 2019; in France, from 28% to 32%; in Sweden it stays below 30%. The sharpest rises came with major transformations: India (from 32% to 56%), China (from 27% to 41%), and above all Russia after the end of the USSR (from 21% to 50% in ten years). South Africa (65%), Chile and Brazil (nearly 60%) are the most unequal.
Limits
For many poor countries without tax data or recent surveys, the database estimates these shares from neighbouring countries: these figures are approximations. The series stops in 2019 in this version. The world average is the countries' average weighted by population, and its rise mostly reflects China and India.
Sources : World Inequality Database, via Gapminder (CC BY 4.0)
In the same theme : Inequality
All maps
Page updated on 2026-11-03.