Household electricity prices
What an average household (2,500 to 5,000 kWh a year) pays per kilowatt-hour, taxes included, in euro cents. European data.
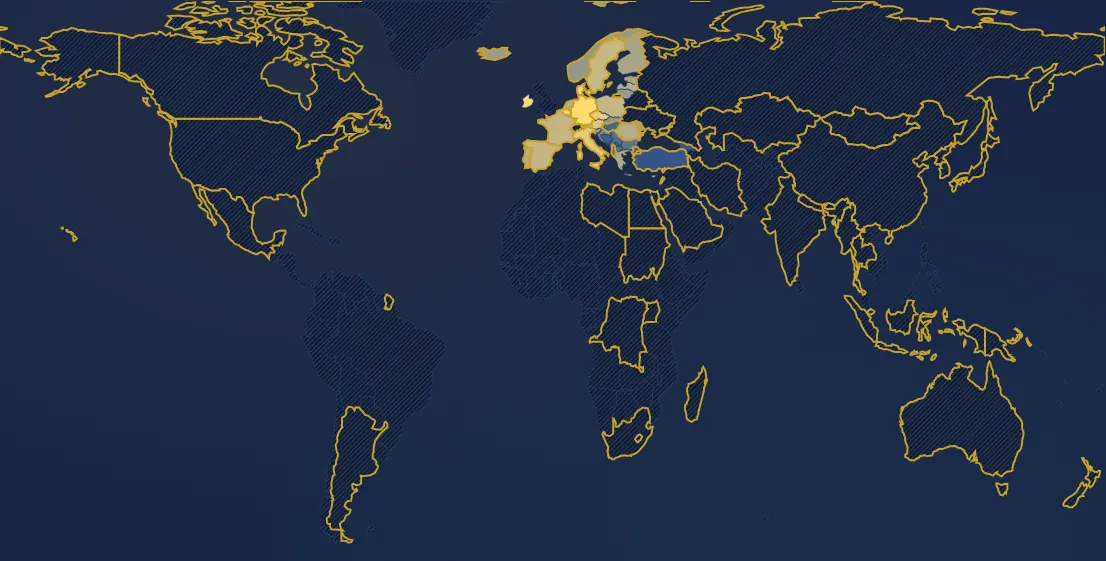
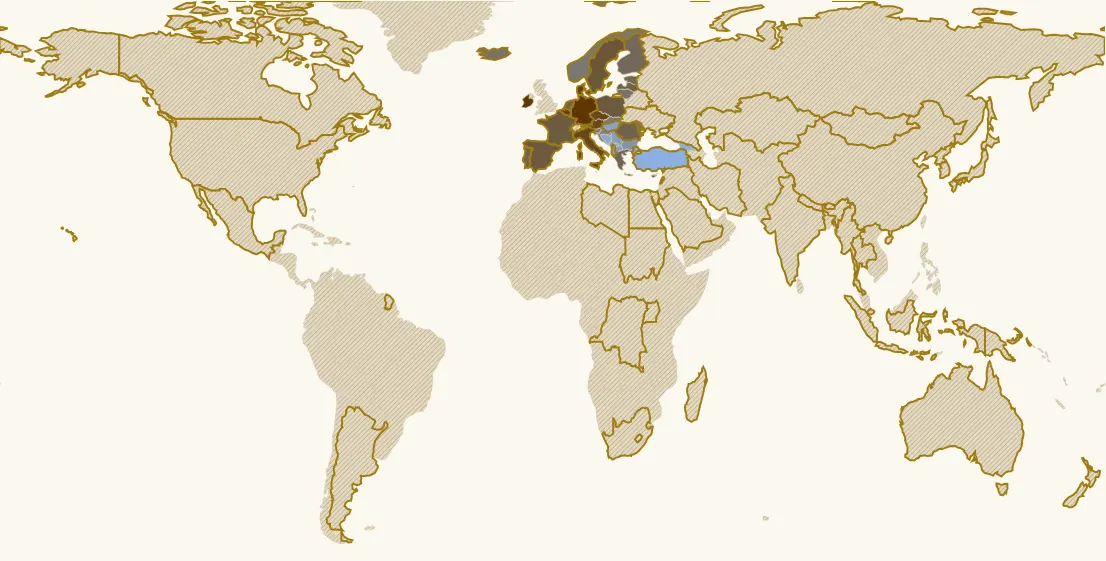
In 2025, 38 countries have a value. Highest: Germany (38.5 c€/kWh), Ireland (36.4 c€/kWh), Belgium (35.4 c€/kWh). Lowest: Türkiye (6.3 c€/kWh), Georgia (7.4 c€/kWh), Kosovo (8.2 c€/kWh). France: 26.2 c€/kWh (13th of 38).
Country ranking in 2025
| Rank | Country | Value |
|---|---|---|
| 1 | Germany its history → | 38.5 c€/kWh |
| 2 | Ireland | 36.4 c€/kWh |
| 3 | Belgium | 35.4 c€/kWh |
| 4 | Denmark | 34 c€/kWh |
| 5 | Czechia | 32 c€/kWh |
| 6 | Italy | 31.3 c€/kWh |
| 7 | Austria | 30.9 c€/kWh |
| 8 | Cyprus | 28.5 c€/kWh |
| 9 | Sweden its history → | 26.8 c€/kWh |
| 10 | Luxembourg | 26.7 c€/kWh |
| 11 | Spain its history → | 26.4 c€/kWh |
| 12 | Poland | 26.3 c€/kWh |
| 13 | France its history → | 26.2 c€/kWh |
| 14 | Netherlands its history → | 24.7 c€/kWh |
| 15 | Latvia | 24.5 c€/kWh |
| 16 | Portugal its history → | 24.1 c€/kWh |
| 17 | Romania | 24.1 c€/kWh |
| 18 | Greece | 23.4 c€/kWh |
| 19 | Estonia | 23 c€/kWh |
| 20 | Finland | 22.6 c€/kWh |
| 21 | Moldova | 20.6 c€/kWh |
| 22 | Iceland | 20.5 c€/kWh |
| 23 | Lithuania | 20.3 c€/kWh |
| 24 | Slovenia | 19.7 c€/kWh |
| 25 | Norway | 19.5 c€/kWh |
| 26 | Slovakia | 18.7 c€/kWh |
| 27 | Croatia | 16.4 c€/kWh |
| 28 | Bulgaria | 13.3 c€/kWh |
| 29 | Malta | 12.8 c€/kWh |
| 30 | Albania | 11.7 c€/kWh |
| 31 | North Macedonia | 11.5 c€/kWh |
| 32 | Serbia | 11.5 c€/kWh |
| 33 | Hungary its history → | 10.6 c€/kWh |
| 34 | Montenegro | 9.9 c€/kWh |
| 35 | Bosnia & Herzegovina | 9.5 c€/kWh |
| 36 | Kosovo | 8.2 c€/kWh |
| 37 | Georgia | 7.4 c€/kWh |
| 38 | Türkiye | 6.3 c€/kWh |
140 countries or territories have no value that year.
Continent averages
| Europe (median of countries) | 22.8 c€/kWh |
Understanding this map
What this figure measures
The household price adds up three things: the electricity itself (generation and supplier margin), delivery through the grid, and taxes. The wholesale price only measures the first, as traded on the European market. Both are given in euro cents per kilowatt-hour so they can be compared: in France in 2025, about 6 cents on the wholesale market, 26 cents on the bill.
Why prices differ
The power mix matters (nuclear and hydro stabilise costs, gas ties them to world prices), but taxes matter even more: they are nearly half the bill in Denmark, about 30% in France and Germany, under 20% in Bulgaria. In purchasing power, Hungarian or Bulgarian electricity, cheap in euros, weighs far more on household budgets. Because European markets are linked, the wholesale price is set each hour by the most expensive plant needed, often gas-fired.
The 2022 crisis
When Russia cut gas deliveries in 2021-2022, the wholesale price exploded: from 4 cents per kWh in 2019 to 23-28 cents in 2022 in France, Germany or Italy, even as France, with part of its nuclear fleet offline, had to import. Bills followed more slowly, cushioned by price shields (in France the regulated tariff was capped): they remain higher than before the crisis, even after wholesale prices fell back.
Limits
There is no free, comparable series for the rest of the world: the map only covers Europe. Household prices: Eurostat, since 1985 for some countries (consumption band defined slightly differently before 2007), without the United Kingdom after 2019. Wholesale prices: Ember, since 2015. Solar and wind have become the cheapest generation to build worldwide (solar costs fell by about 90% in ten years), but this generation cost only exists as world averages, not by country.
Sources : Eurostat (prix aux ménages, nrg_pc_204) ; Ember (prix de gros européens)
In the same theme : Energy mix
All maps
Page updated on 2026-11-03.