Public spending
Everything spent in a year by the state, local authorities and social security, as a share of the wealth the country produces (GDP).
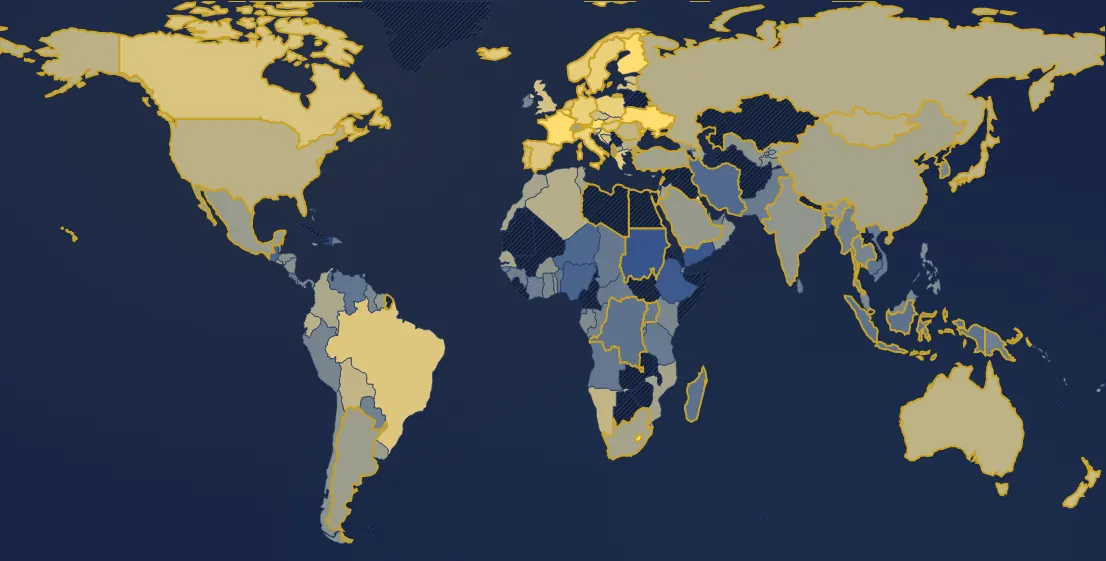
In 2024, 134 countries have a value. Highest: Ukraine (71 %), Finland (58 %), France (57 %). Lowest: Haiti (5 %), Sudan (6 %), Yemen (9 %). World (GDP-weighted average): 35 %. France: 57 % (3rd of 134).
Country ranking in 2024
| Rank | Country | Value |
|---|---|---|
| 1 | Ukraine its history → | 71 % |
| 2 | Finland | 58 % |
| 3 | France its history → | 57 % |
| 4 | Austria | 56 % |
| 5 | Belgium | 55 % |
| 6 | Lesotho | 54 % |
| 7 | Italy | 51 % |
| 8 | Kuwait | 50 % |
| 9 | Germany its history → | 49 % |
| 10 | Poland | 49 % |
| 11 | Sweden its history → | 49 % |
| 12 | Norway | 49 % |
| 13 | Greece | 48 % |
| 14 | Croatia | 48 % |
| 15 | Denmark | 47 % |
| 16 | Slovakia | 47 % |
| 17 | Luxembourg | 47 % |
| 18 | Hungary its history → | 47 % |
| 19 | Iceland | 47 % |
| 20 | Slovenia | 47 % |
| 21 | Brazil | 46 % |
| 22 | Spain its history → | 45 % |
| 23 | Canada | 45 % |
| 24 | Latvia | 45 % |
| 25 | Netherlands its history → | 44 % |
| 26 | United Kingdom | 44 % |
| 27 | Israel | 44 % |
| 28 | Estonia | 44 % |
| 29 | Bosnia & Herzegovina | 43 % |
| 30 | Portugal its history → | 43 % |
| 31 | Czechia | 43 % |
| 32 | New Zealand | 42 % |
| 33 | Vanuatu | 41 % |
| 34 | Cyprus | 40 % |
| 35 | Namibia | 40 % |
| 36 | Romania | 40 % |
| 37 | Bolivia | 40 % |
| 38 | Japan | 39 % |
| 39 | Australia its history → | 39 % |
| 40 | Ecuador | 38 % |
| 41 | Moldova | 38 % |
| 42 | United States | 38 % |
| 43 | Mongolia | 38 % |
| 44 | Russia | 37 % |
| 45 | Algeria | 37 % |
| 46 | Bulgaria | 37 % |
| 47 | North Macedonia | 37 % |
| 48 | Solomon Islands | 36 % |
| 49 | Colombia | 35 % |
| 50 | Azerbaijan | 34 % |
| 51 | Tunisia | 34 % |
| 52 | Kyrgyzstan | 34 % |
| 53 | Senegal | 34 % |
| 54 | Mozambique | 33 % |
| 55 | South Africa | 33 % |
| 56 | Jordan | 33 % |
| 57 | Morocco | 33 % |
| 58 | China | 33 % |
| 59 | Eswatini | 33 % |
| 60 | Türkiye | 33 % |
| 61 | Trinidad & Tobago | 33 % |
| 62 | Switzerland its history → | 32 % |
| 63 | El Salvador | 31 % |
| 64 | Uruguay | 31 % |
| 65 | Argentina its history → | 31 % |
| 66 | Fiji | 31 % |
| 67 | Mexico | 30 % |
| 68 | Georgia | 30 % |
| 69 | Jamaica | 30 % |
| 70 | Saudi Arabia | 30 % |
| 71 | Suriname | 29 % |
| 72 | Albania | 29 % |
| 73 | Rwanda | 29 % |
| 74 | Oman | 29 % |
| 75 | India its history → | 28 % |
| 76 | Burkina Faso | 28 % |
| 77 | Tajikistan | 28 % |
| 78 | Uzbekistan | 28 % |
| 79 | Nicaragua | 27 % |
| 80 | Bhutan | 27 % |
| 81 | Chile | 27 % |
| 82 | Togo | 26 % |
| 83 | Belize | 26 % |
| 84 | Qatar | 26 % |
| 85 | Honduras | 26 % |
| 86 | Philippines | 25 % |
| 87 | Gabon | 25 % |
| 88 | Malaysia | 24 % |
| 89 | Kenya | 23 % |
| 90 | Guyana | 23 % |
| 91 | Ghana | 23 % |
| 92 | Panama | 23 % |
| 93 | Thailand | 23 % |
| 94 | South Korea | 23 % |
| 95 | Ireland | 22 % |
| 96 | Peru | 22 % |
| 97 | Burundi | 22 % |
| 98 | Congo - Brazzaville | 22 % |
| 99 | United Arab Emirates | 21 % |
| 100 | Paraguay | 21 % |
| 101 | Bahamas | 21 % |
| 102 | Myanmar (Burma) | 21 % |
| 103 | Djibouti | 21 % |
| 104 | Guinea | 21 % |
| 105 | Guinea-Bissau | 20 % |
| 106 | Côte d’Ivoire | 20 % |
| 107 | Papua New Guinea | 20 % |
| 108 | Dominican Republic | 20 % |
| 109 | Pakistan | 20 % |
| 110 | Central African Republic | 20 % |
| 111 | Sri Lanka | 19 % |
| 112 | Vietnam | 19 % |
| 113 | Tanzania | 19 % |
| 114 | Costa Rica | 19 % |
| 115 | Chad | 19 % |
| 116 | Uganda | 19 % |
| 117 | Equatorial Guinea | 19 % |
| 118 | Angola | 18 % |
| 119 | Benin | 18 % |
| 120 | Venezuela | 18 % |
| 121 | Cambodia | 17 % |
| 122 | Indonesia | 17 % |
| 123 | Congo - Kinshasa | 17 % |
| 124 | Lebanon | 17 % |
| 125 | Madagascar | 16 % |
| 126 | Iran | 14 % |
| 127 | Guatemala | 13 % |
| 128 | Niger | 13 % |
| 129 | Nigeria | 12 % |
| 130 | Bangladesh | 12 % |
| 131 | Ethiopia | 10 % |
| 132 | Yemen | 9 % |
| 133 | Sudan | 6 % |
| 134 | Haiti | 5 % |
44 countries or territories have no value that year.
Continent averages
| World (GDP-weighted average) | 35 % |
| Europe (average) | 45 % |
| Africa (average) | 23 % |
| Americas (average) | 37 % |
| Asia (average) | 29 % |
| Oceania (average) | 39 % |
Understanding this map
What this figure measures
It adds up all public spending: civil servants' pay, pensions and benefits, health, education, the military, roads, interest on debt. When it exceeds 50%, it does not mean the state “consumes” half of the wealth: much of it is passed on to households (pensions, benefits), who then spend it themselves.
The great growth of the state
Before 1914 the states of rich countries spent around 10% of GDP (France 10 to 13%, the UK 6 to 8%), mostly on the military, police, justice and debt. Wars make spending leap (UK: 68% in 1916, 63% in 1944), and it never quite falls back to the old level. Then the welfare state (pensions, health, education, unemployment insurance) takes it to 40-60% of GDP: France is at 57% in 2024, among the highest in the world.
Limits
The IMF database uses general government when the figure exists, otherwise central government only. For several rich countries the series changes scope between 1960 and 1993, creating a false jump: in France, 21% in 1977 (central government) then 45% in 1978 (general government). The curve is broken at that point and the tooltip says so. Before 1950 few countries are covered; the world average (GDP-weighted) only appears from 1929.
Sources : FMI, Public Finances in Modern History (Mauro et al.)
In the same theme : Public finances
All maps
Page updated on 2026-11-03.