Big state, big debt?
The countries that spend most are not the most indebted. What creates debt is failing to pay for what you spend, year after year. A tour of rich countries: who borrows, why, who holds the debt, and how some brought theirs down.
Public debt is the sum of everything the state, local authorities and social security have borrowed and not yet repaid. It is compared with GDP, the wealth produced in a year: a debt of 100% of GDP equals a whole year of the country's output. It is often seen as the price of a "big state". The figures tell a somewhat different story.
Who is in debt?
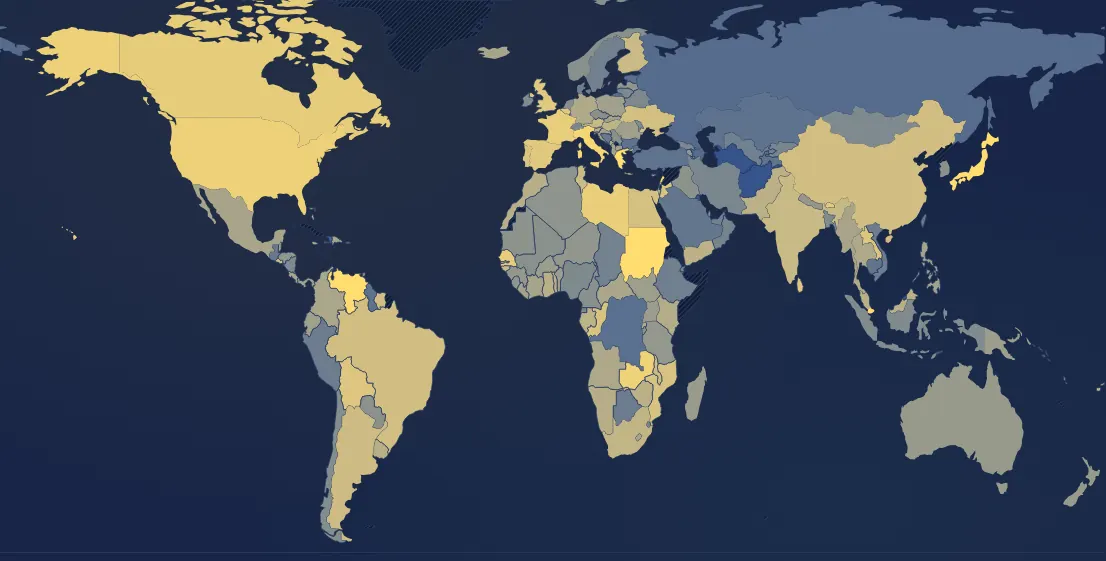
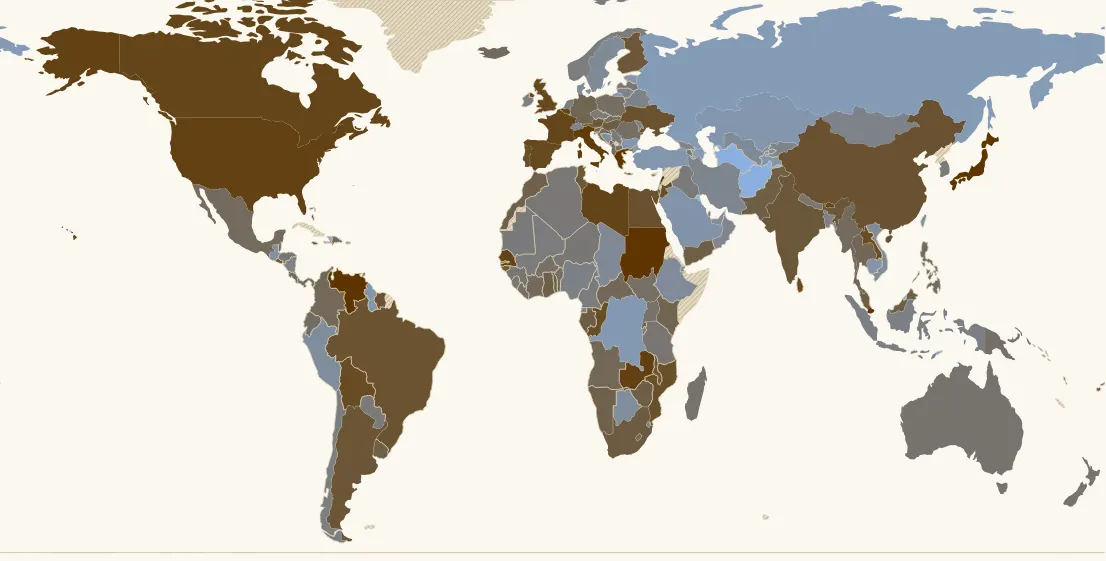
In 2024, among rich countries, Japan is far ahead (237% of GDP), followed by Italy (135%), the United States (122%), France (113%), Canada (111%), Belgium (105%), Spain (102%) and the United Kingdom (101%). At the other end, Switzerland (38%), Denmark (32%), Sweden (33%) or Estonia (23%) owe three to ten times less relative to their wealth.
France long had little debt: 21% of GDP in 1980, 35% in 1990, 57% in 2000. Debt then rose with each crisis and never came back down: 64% in 2007, 98% in 2019, 115% in 2020 with Covid.
It is not the size of the state
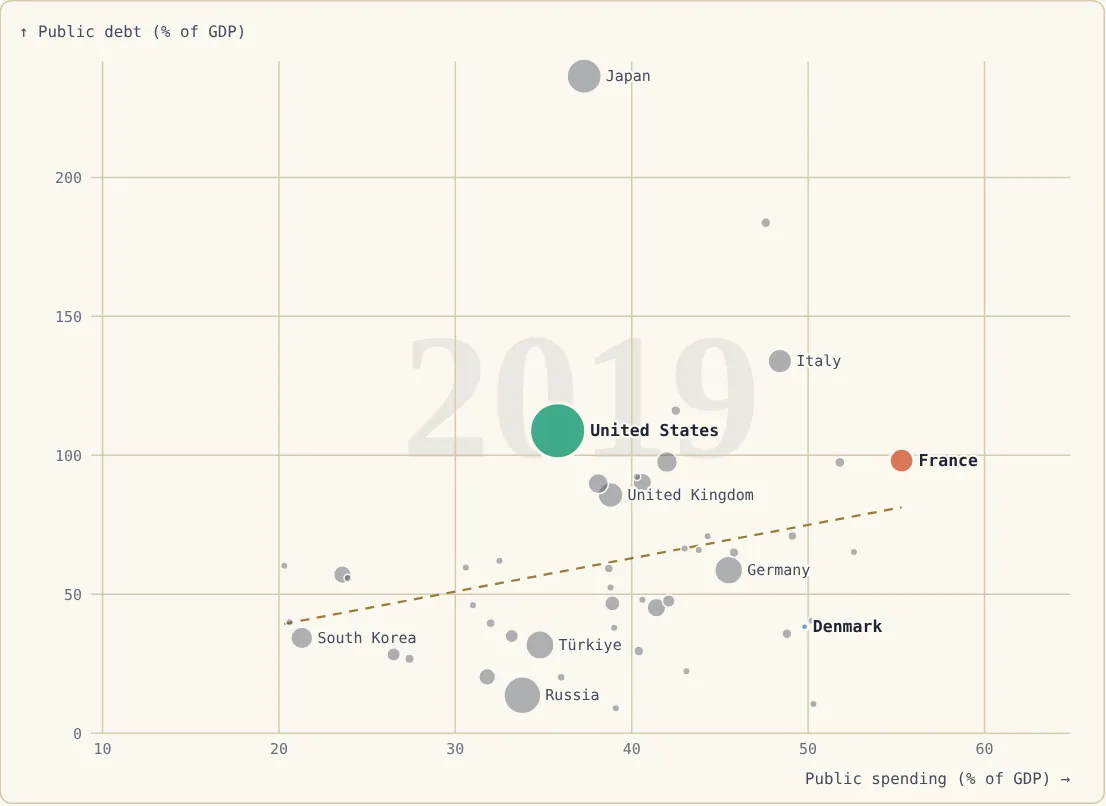
If debt were the price of a big state, the countries that spend most would be the most indebted. They are not: among rich countries, the level of public spending and debt are almost unrelated (r ≈ 0.17 in 2019). Denmark and Sweden spend around 50% of GDP and owe barely more than a third of it. The United States (36% spending) and Japan (37%) have lighter states and some of the heaviest debts in the world.
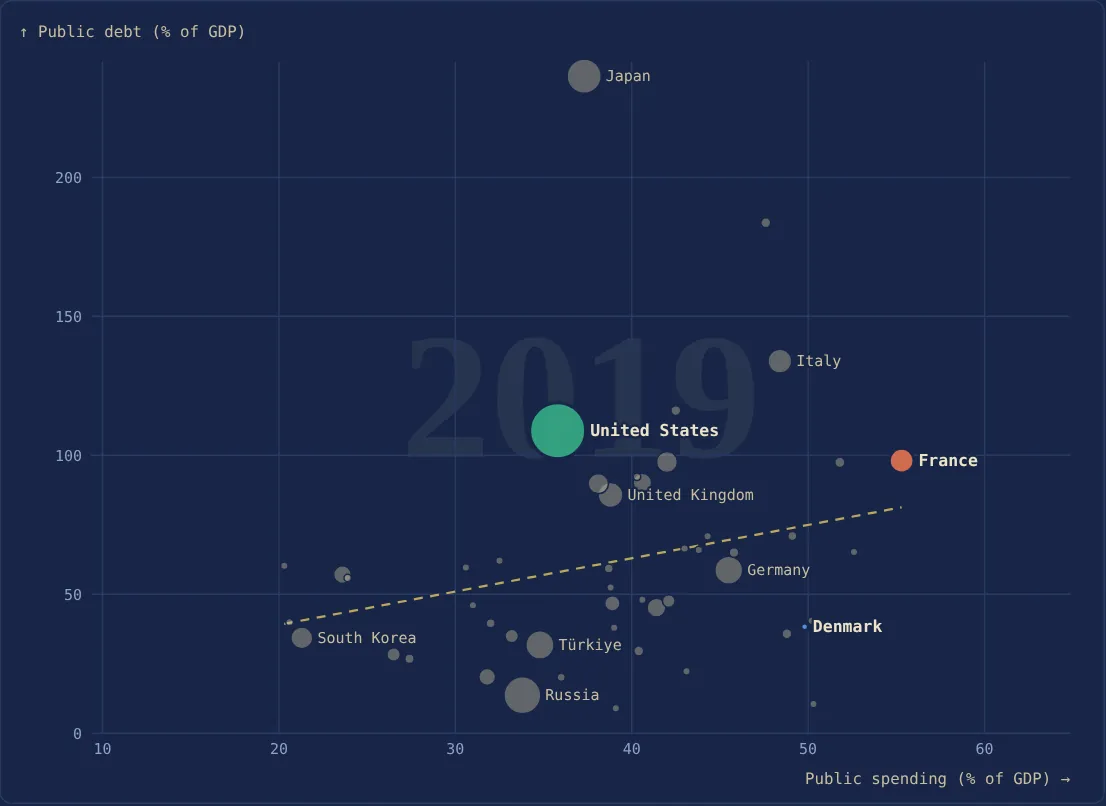
What creates debt is the gap between what is spent and what is collected, repeated year after year. Debt in 2019 tracks the average deficit of the previous twenty years (r ≈ 0.51) far better than the level of spending. Denmark pays for its big state through taxes; the United States funds part of its light state by borrowing. In 2019, Denmark collected 54% of GDP in public revenue for 50% of spending; the United States 30% for 36%.
The number of deficit years shows it clearly. Since 1995, France has run a deficit 30 years out of 30, like Italy and Japan. It has not had a budget surplus since the mid-1970s. Over the same period, Denmark ran a deficit in only 11 years, Switzerland 14, Sweden 16, South Korea 4.
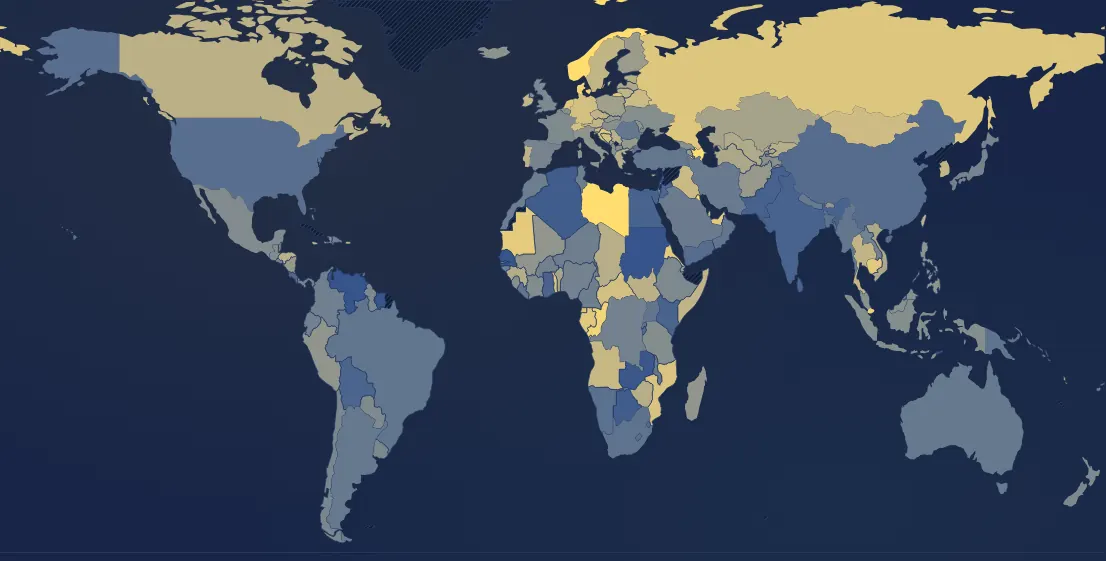
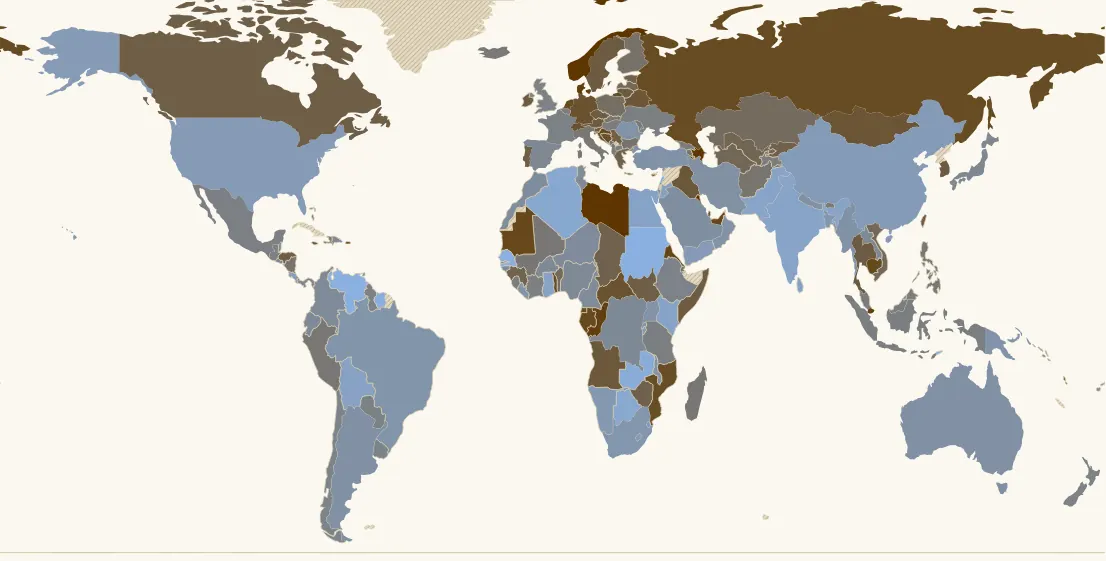
Debt does not come only from day-to-day spending. It also jumps in crises: bank rescues and recession in Ireland (from 24% of GDP in 2007 to 119% in 2012) and in Spain (from 36% to 104% between 2007 and 2014), then Covid everywhere in 2020. The difference between countries comes afterwards: some bring their debt back down after the crisis, others do not.
The weight of ageing
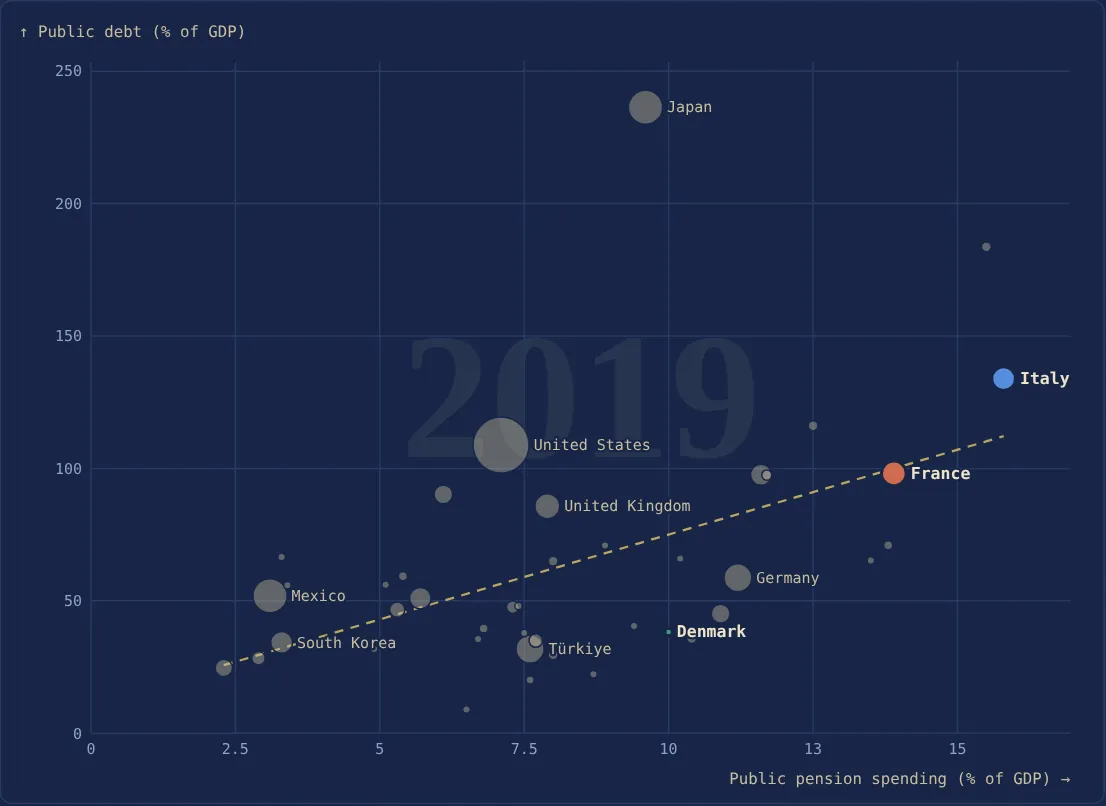
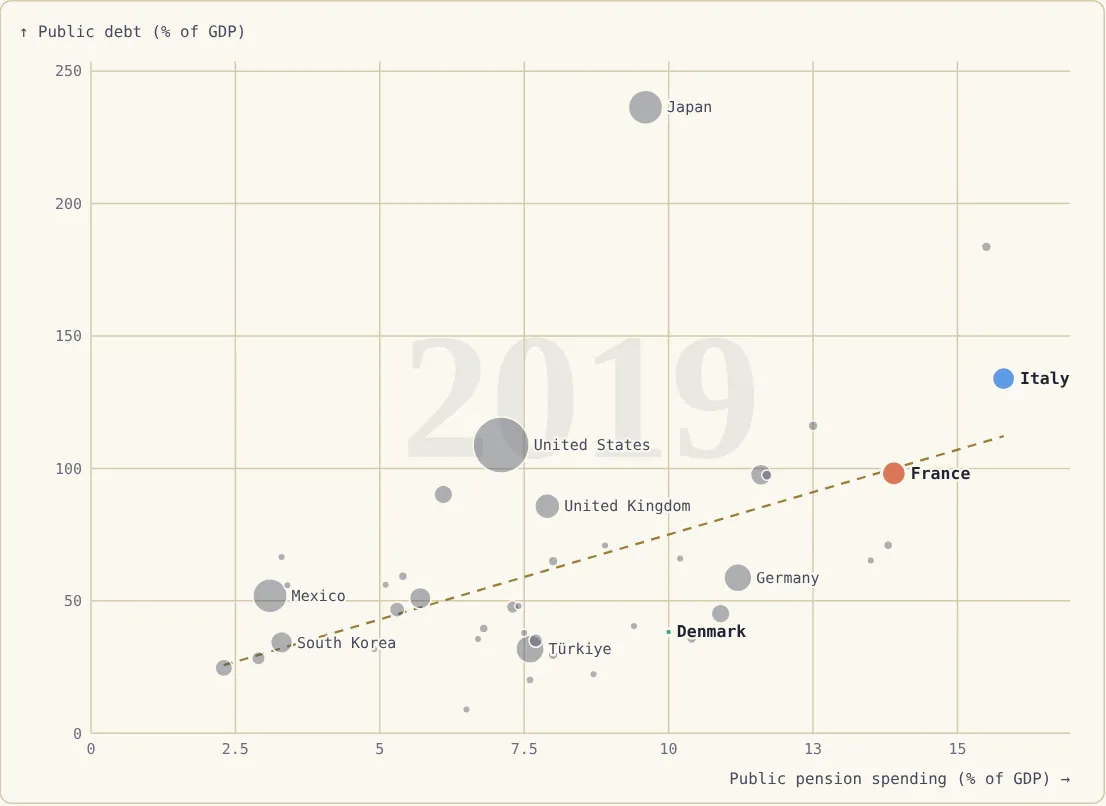
Older countries are more indebted. Among OECD countries, the share of people aged 65 and over and debt are clearly linked (r ≈ 0.49), and so is public pension spending (r ≈ 0.51). Japan, the oldest country in the world, and Italy, one of the oldest in Europe, are the clearest examples. Pensions paid mainly by the state, rather than from savings built up in advance, weigh on public finances as the population ages.
Does debt hold back growth?
The OECD countries that grew least between 2000 and 2019 are the most indebted (r ≈ −0.53). But which way does the link run? An economy that grows little collects less tax and spends more on benefits: it borrows. Conversely, high debt can hold back growth if it forces tax rises or pushes up interest rates.
In 2010, Carmen Reinhart and Kenneth Rogoff claimed that above 90% of GDP, growth fell sharply. In 2013, Thomas Herndon, Michael Ash and Robert Pollin found a spreadsheet error and debatable calculation choices in their study: once corrected, the sharp drop disappears, leaving somewhat slower growth, on average, in very indebted countries. The site's data point the same way: among rich countries, debt in 2000 says almost nothing about growth over the following twenty years (r ≈ 0.02). The link seems to run mainly from weak growth to debt rather than the other way round.
Who is owed?
A state borrows by selling bonds, bought by banks, insurers, pension funds, savers and central banks, at home or abroad. Who holds them changes the risks a lot.
Japan can owe more than twice its GDP because its debt is held almost entirely in Japan: only 11% abroad, and about half by its own central bank. These lenders will not leave at the first doubt. Switzerland (6%) and the United Kingdom (18%) are also financed mainly by their residents. France, by contrast, is one of the rich countries whose debt is most held outside its borders: a little over half. That is not necessarily a danger: in the euro area, a German investor holding French debt counts as "foreign", even though everything is in euros. But foreign creditors are quicker to sell if confidence is lost, as Greece experienced in 2010.
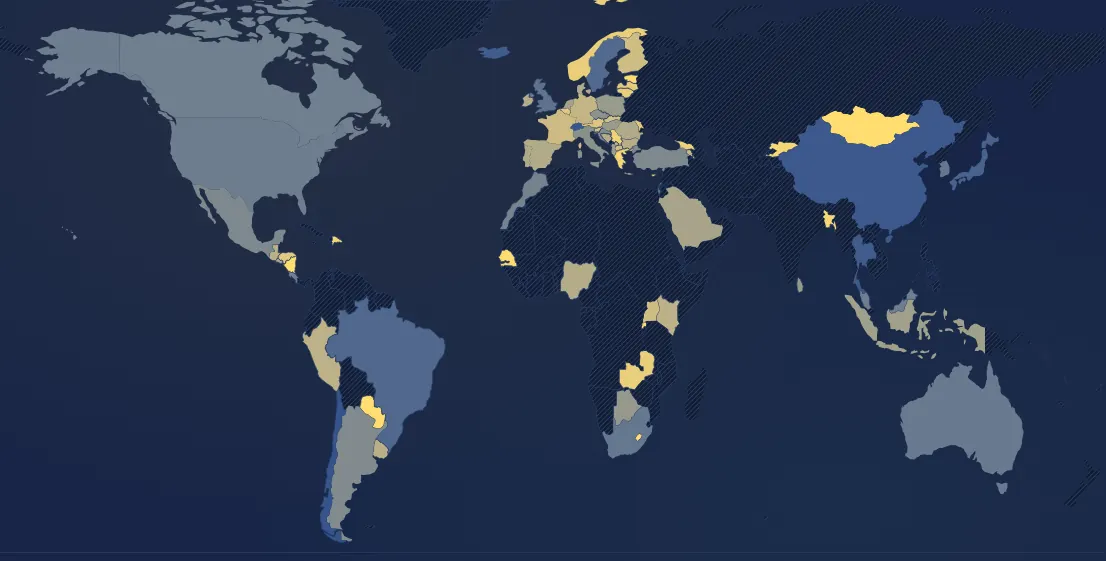
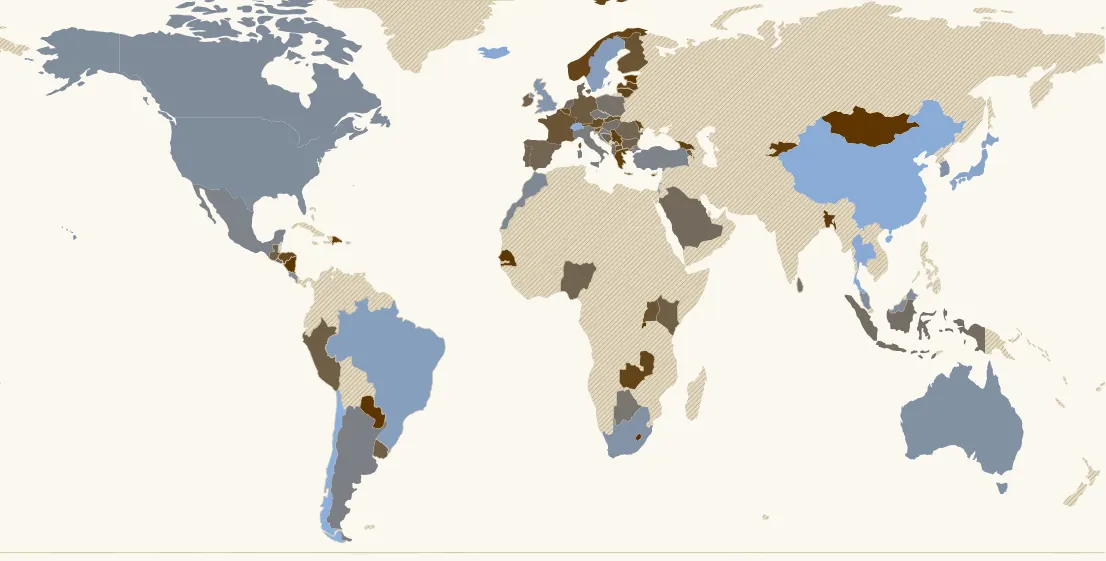
Central banks have also bought a great deal of public debt since 2015, in Japan, the United States, the United Kingdom and the euro area (through the ECB and national central banks, including the Banque de France). That kept rates very low. Since 2022 they have been scaling back: other buyers must be found, at higher rates.
Interest is back
A state almost never repays its debt: it borrows again to repay what falls due. What it really pays is interest. During the years of very low rates, French debt almost doubled while interest fell: it absorbed 6.6% of tax revenue in 2000, only 3.1% in 2021. With rates rising since 2022, it is climbing again: 4.7% in 2024, and still rising as old loans are replaced by new, more expensive ones.
Elsewhere the burden is already heavy: in 2024, interest absorbs 16% of taxes in the United States, 10% in Canada, 9% in Italy and 8% in the United Kingdom, against less than 2% in Switzerland, Denmark or the Netherlands.
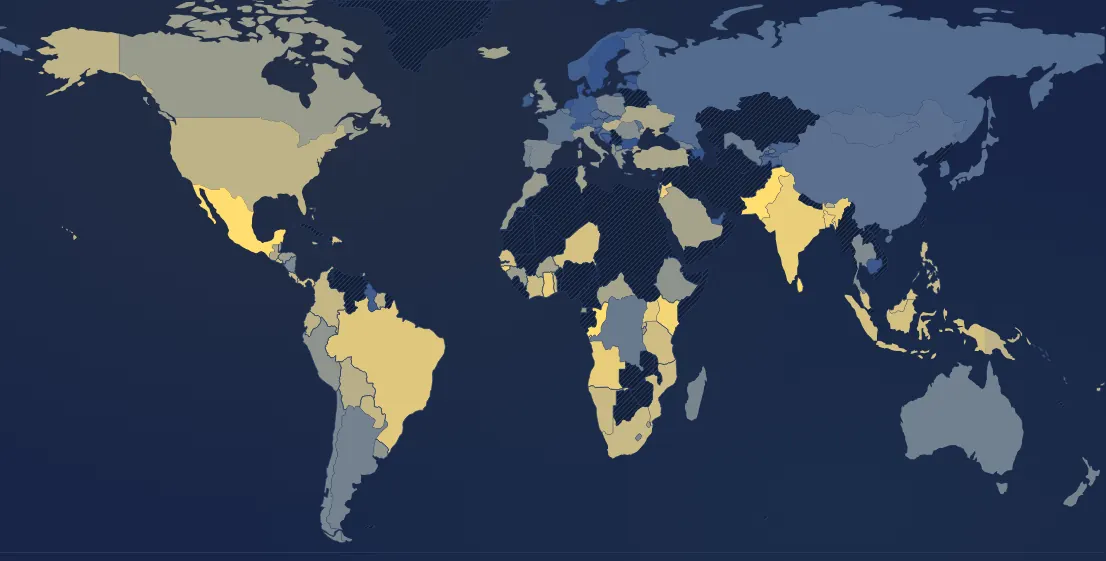
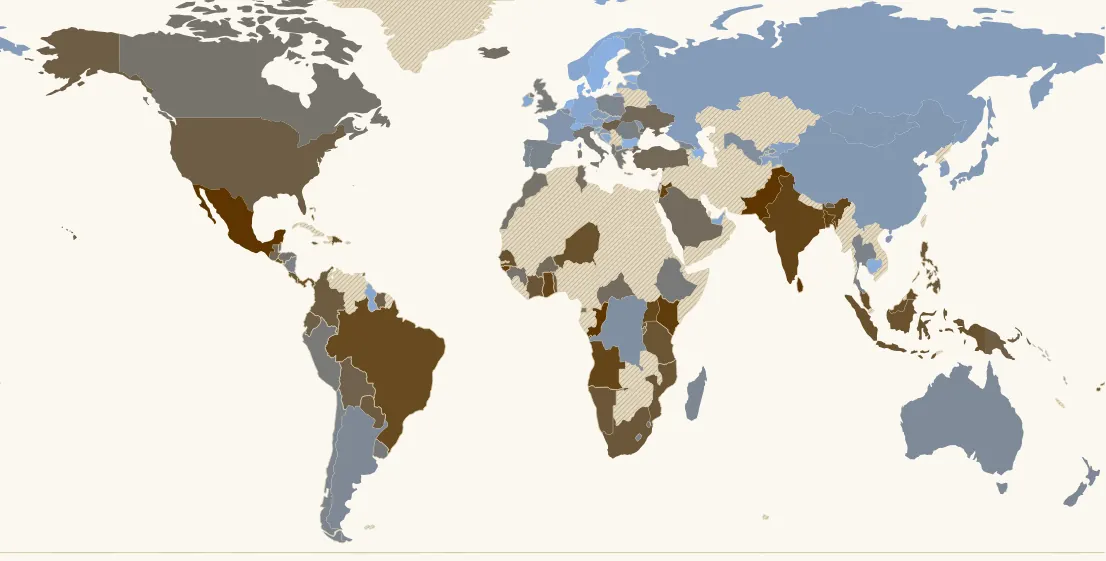
Whether debt grows by itself depends on the gap between the average interest rate paid (r) and the growth of the economy in current money (g). As long as r is below g, debt can stabilise as a share of GDP even with a small deficit excluding interest. For France in 2024, g exceeds r by about 1.8 points: with debt at 113% of GDP, it could stabilise with a deficit excluding interest of about 2% of GDP. That deficit was 3.7%, so debt keeps rising. And the gap is narrowing as the rates paid catch up with market rates.
Debt can be brought down
Several countries have done it, with states of every size.
- Denmark cut its debt from 81% of GDP in 1993 to 27% in 2007, and Sweden from 69% in 1996 to 39% in 2007, after severe banking crises. In the late 1990s Sweden adopted an annual spending ceiling and a target of a budget surplus over the economic cycle.
- Canada went from 102% in 1996 to 67% in 2007, after a massive savings plan launched in 1995.
- Switzerland adopted by referendum in 2001 a "debt brake", applied since 2003: over a cycle, the federal government cannot spend more than its revenue. Its debt fell from 57% in 2003 to 38% in 2024.
- Germany wrote a similar rule into its constitution in 2009. Its debt fell from 81% in 2010 to 59% in 2019.
- Ireland came back from 119% in 2012 to 41% in 2024, helped, admittedly, by very strong growth and taxes paid by multinationals.
All of them combined three things: a clear rule, kept over time, spending savings, and growth that made GDP rise faster than debt.
Conclusion
Debt is not the price of a big state: it is the price of a state that does not pay for what it spends. The Nordic countries show it one way, with high public spending and little debt; the United States and Japan the other, with less spending and a lot of debt.
France, for its part, has the highest public spending among rich countries and a deficit every year for almost fifty years. That is where the free-market critique bites: every expense not paid by taxes is paid by debt, and that debt has become expensive again since rates rose. But there are two ways to fix it, and foreign examples show both work: spend less, like Canada or Switzerland, or collect enough to pay for what you spend, like Denmark or Sweden. What does not work is doing neither.
The real issue is therefore not "more or less state" but discipline: a rule kept over time, surpluses in good years, and spending that delivers results. The countries that did it did not sacrifice their social protection, and today they borrow more cheaply than the others.
Limits
The figures are for gross debt. Some states also hold large assets: Norway has a sovereign wealth fund worth several times its GDP, and Japan's net debt is much lower than its gross debt. 2020-2021 are inflated by Covid. Definitions vary slightly between countries (general government or central government only). The share held abroad is published by only about 80 countries, often only since 2008-2010. Finally, these correlations between countries do not say what would happen in a given country if one thing were changed.
Sources
- IMF, Public Finances in Modern History (Mauro et al.) and World Economic Outlook (debt, deficit, spending, revenue, interest); UNU-WIDER, Government Revenue Dataset (taxes); OECD (interest rates, pension spending); United Nations (population age).
- World Bank, Quarterly Public Sector Debt, and Eurostat (debt held by non-residents).
- C. Reinhart and K. Rogoff, "Growth in a Time of Debt", American Economic Review, 2010; T. Herndon, M. Ash and R. Pollin, "Does high public debt consistently stifle economic growth? A critique of Reinhart and Rogoff", Cambridge Journal of Economics, 2014.
- O. Blanchard, "Public Debt and Low Interest Rates", American Economic Review, 2019 (on the r − g gap).