Freer markets, richer… and more unequal?
The most economically free countries are clearly richer. Are they also more unequal, with more poor people? Only partly. It depends on which piece of "economic freedom" you look at, and on which kind of poverty.
Two opposite claims come up again and again. One says free markets make countries rich. The other says they mostly make the rich richer and leave the poor behind. The site's data let us look at both at once, across a dozen rich countries and across the whole world.
The most widely used measure of "economic freedom" is the Fraser Institute's: a score from 0 to 10 where a high score always means "more free-market". It is the average of five areas, each also scored from 0 to 10:
- Size of government: the less the state spends, taxes and redistributes, the higher the score. Switzerland gets 7.7, France 5.2.
- Legal system and property rights: independent courts, contracts enforced, property protected.
- Sound money: low and stable inflation.
- Freedom to trade internationally: few tariffs and barriers.
- Regulation: light constraints on labour, credit and business.
This breakdown matters: as we will see, the five areas say very different things.
Why 2019? Inequality and poverty figures stop in 2021, and 2020-2021 are distorted by Covid (GDP collapse, emergency aid inflating public spending). 2019 is therefore the last "normal" year for which everything is available. The links described here are the same with the latest figures: economic freedom and GDP per person, r ≈ 0.66 in 2024; the "size of government" area and inequality, r ≈ +0.68 in 2021.
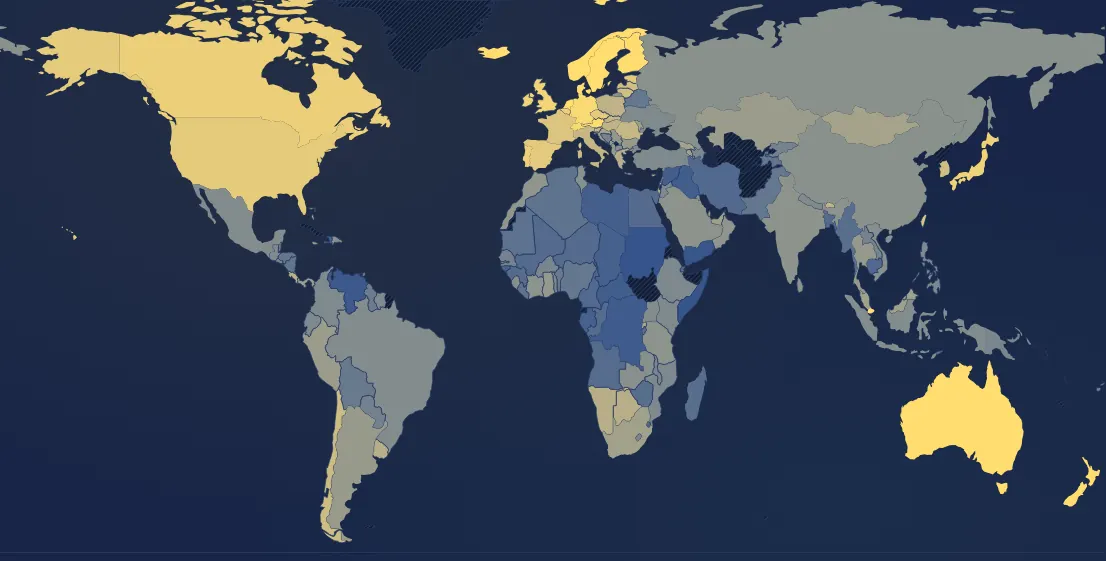
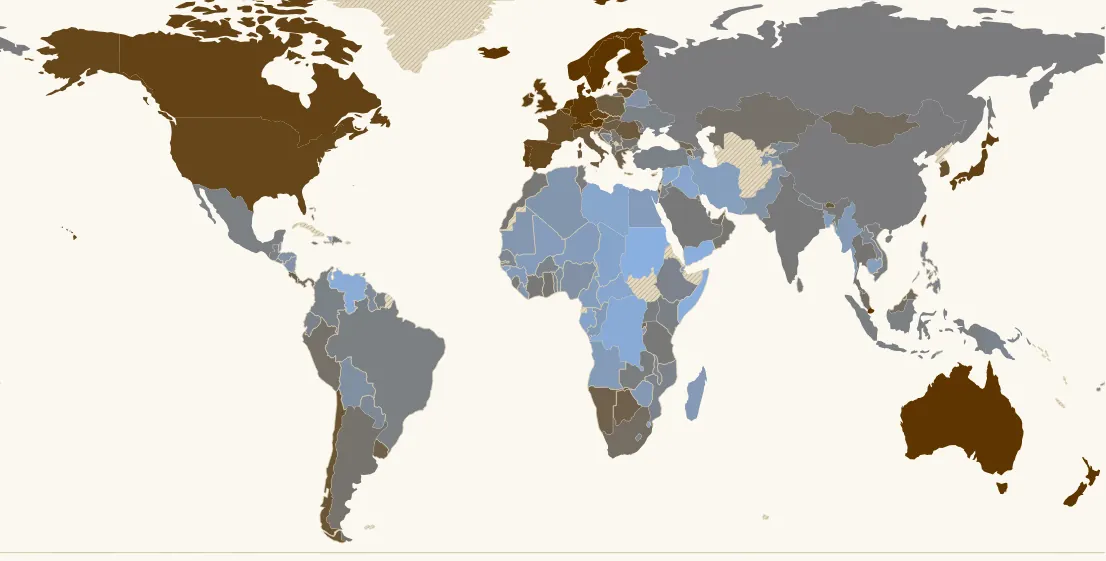
Freer, richer: yes, clearly
This is the strongest link. In 2019, across 158 countries, the Fraser score and GDP per person are closely related (r ≈ 0.66). It is not just a snapshot: between 1995 and 2019, the countries whose score rose most also grew fastest (r ≈ 0.40 across 119 countries), even when starting from the same level of wealth (r ≈ 0.38). Estonia, Georgia and Chile are well-known examples.
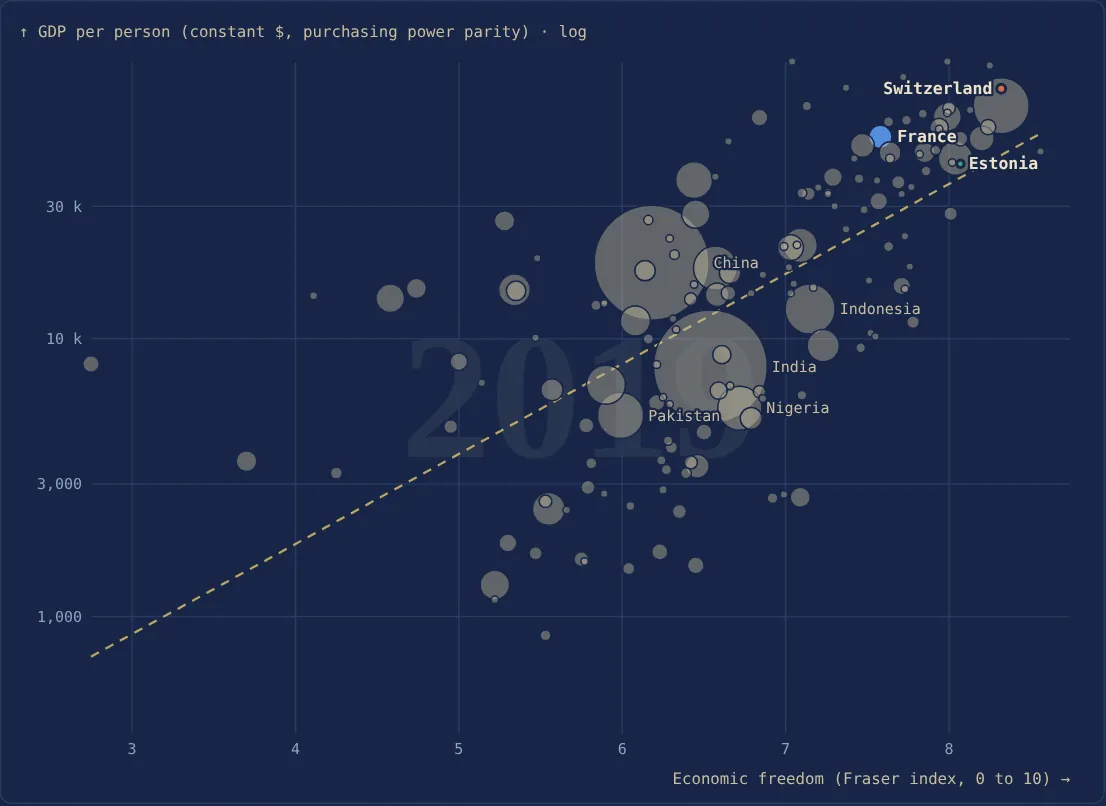
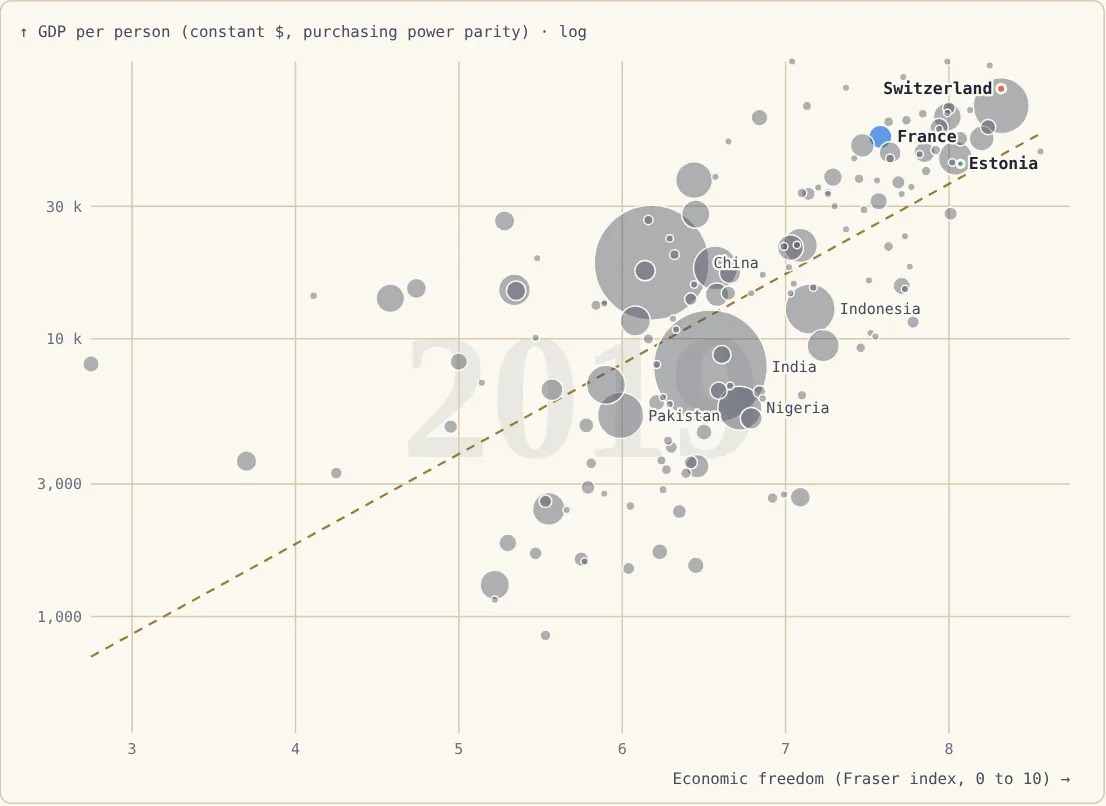
Two details change the reading, though.
The link runs mainly through the law. The "legal system and property rights" area is the one most closely tied to wealth (r ≈ 0.77). The "size of government" area, on the other hand, does not separate rich countries: public spending and GDP per person are almost unrelated among them (r ≈ 0.04 across 33 rich countries). Some very rich countries have a light state, like Switzerland (public spending of 32% of GDP), the United States (36%) or Ireland (24%); others have a heavy one, like Norway or Denmark (50%). Worldwide, rich countries have bigger states on average than poor ones, but mostly because wealth makes a big state affordable, not the other way round.
Among countries that are already rich, the effect fades. Among the 21 countries that were already above $30,000 per person in 1995, those that liberalised further did not grow faster than the others (r ≈ 0.05). Economic freedom matters most when a country starts far behind: leaving central planning, hyperinflation or rampant corruption pays off handsomely; going from 7.5 to 8 out of 10, much less so.
And as always, the direction of causality is debated: a country that gets richer can also afford better judges. Studies that follow countries over time (Jakob de Haan, Jan-Egbert Sturm and others) nevertheless find a positive effect of market-oriented reforms on growth.
Freer, more unequal? Not necessarily
One might expect the freest countries to be the most unequal. That is not what the figures show. In the OECD, the overall Fraser score and the Gini index of income (after taxes and transfers) are even slightly linked the other way (r ≈ −0.28). Among rich countries only, the link turns positive but stays weak (r ≈ 0.33). And between 1995 and 2019, countries that liberalised did not become more unequal than the others (r ≈ 0.02 worldwide).
Denmark and the Netherlands have some of the highest economic-freedom scores in Europe (8.1 and 8.0) and some of the lowest inequality (Gini of 28). Italy and Spain, with lower scores, are more unequal.
Only one area goes together with inequality: size of government (r ≈ +0.67 in the OECD, a high score meaning a small state). That is almost mechanical: the Gini is measured after taxes and transfers, and a small state redistributes little. Before redistribution, the gaps between rich countries are much smaller: according to the OECD, France is about as unequal as the United States before taxes and transfers, and much less so afterwards.
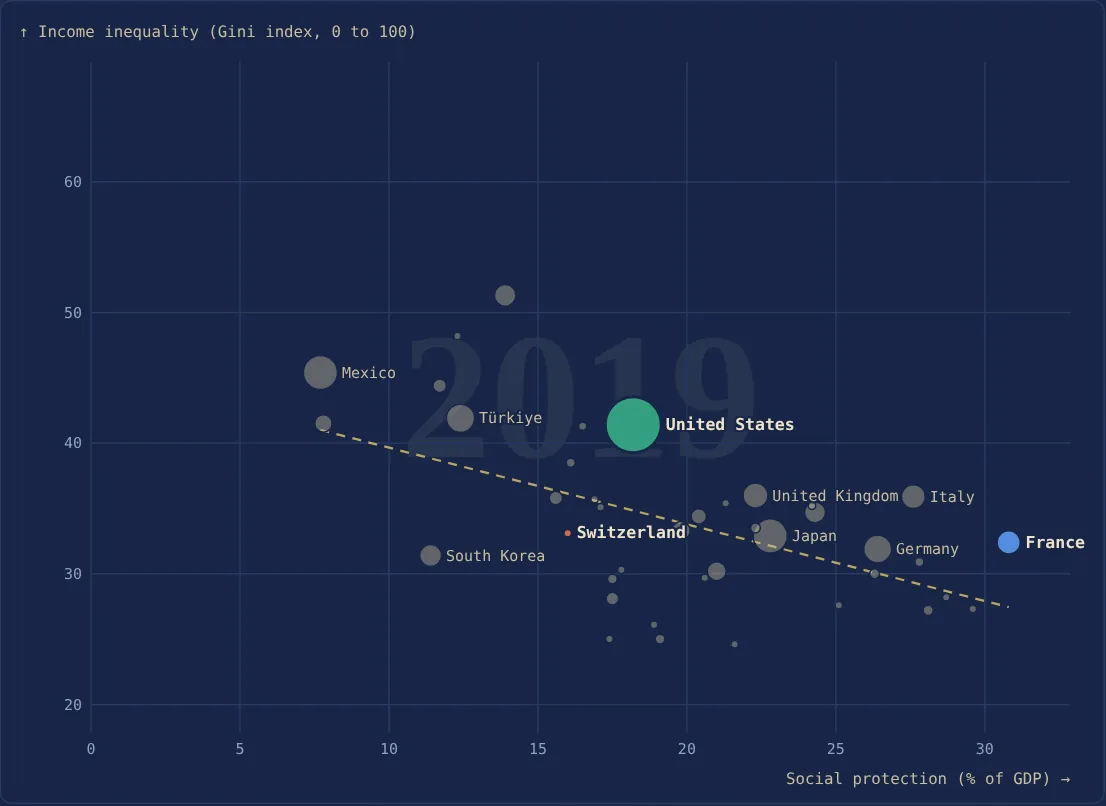
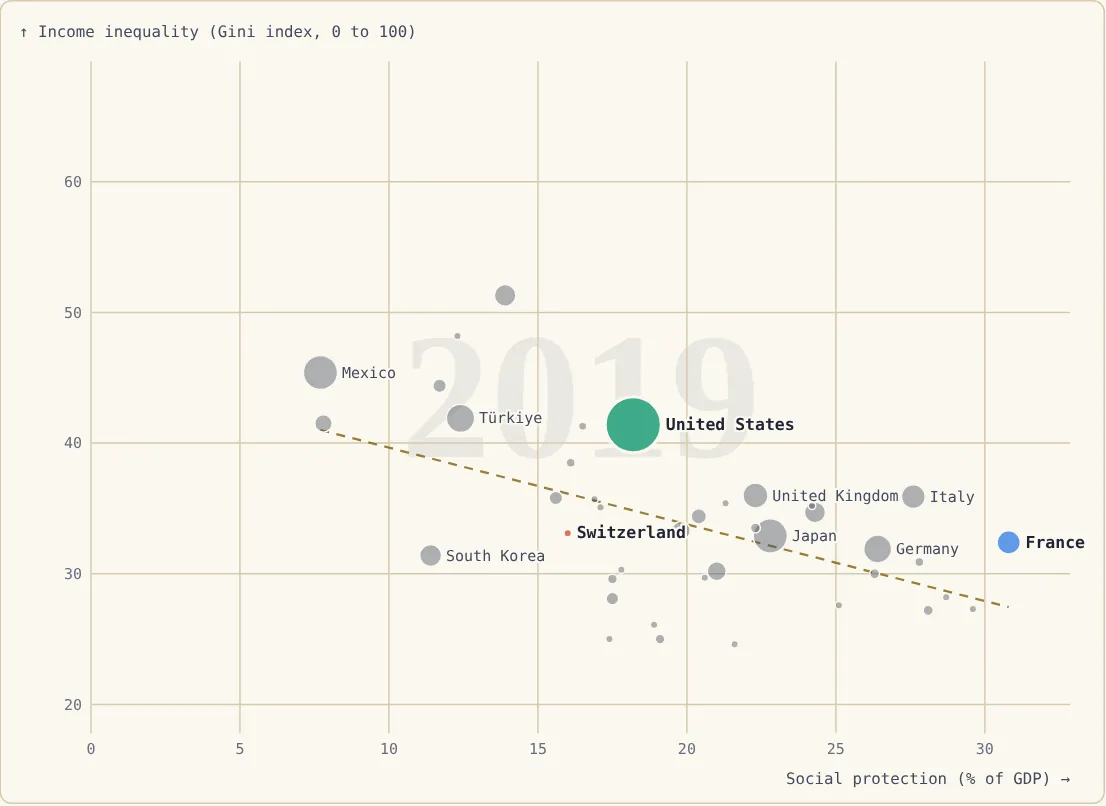
Even that link has limits. Among rich countries, social spending explains almost none of the differences in Gini (r ≈ −0.16). Switzerland has a Gini (33.1) almost equal to France's (32.4) with public social spending half as large (16% of GDP against 31%). Bear in mind, however, that Switzerland funds part of its social protection through schemes that are mandatory but private (notably second-pillar occupational pensions), which this public-spending figure leaves out; so do the Netherlands.
And poverty? It depends which kind
There are two ways of counting the poor, and they do not give the same answer.
Relative poverty counts people living on less than 60% of the median income of their own country. It really measures the distance from the middle of society. In the OECD, the overall Fraser score is not linked to more relative poverty (r ≈ −0.32, and ≈ 0 among rich countries). But the "size of government" area is (r ≈ +0.55): a small state means more people far below the median income.
Poverty at $30 a day (the World Bank's line for rich countries, in purchasing power) counts those who have little, whatever the country. It depends mostly on how rich the country is and on the quality of its legal system (r ≈ −0.81 among rich countries with the "legal system and property rights" area).
Why Switzerland has more relatively poor people, but fewer truly deprived
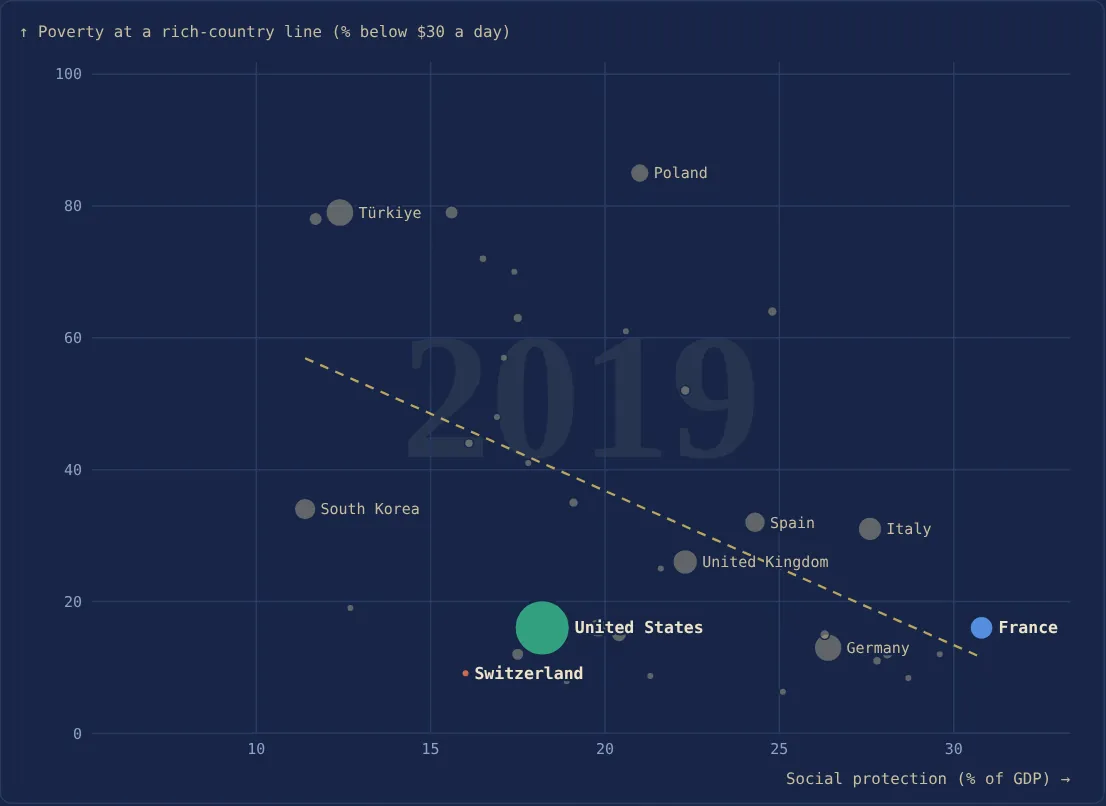
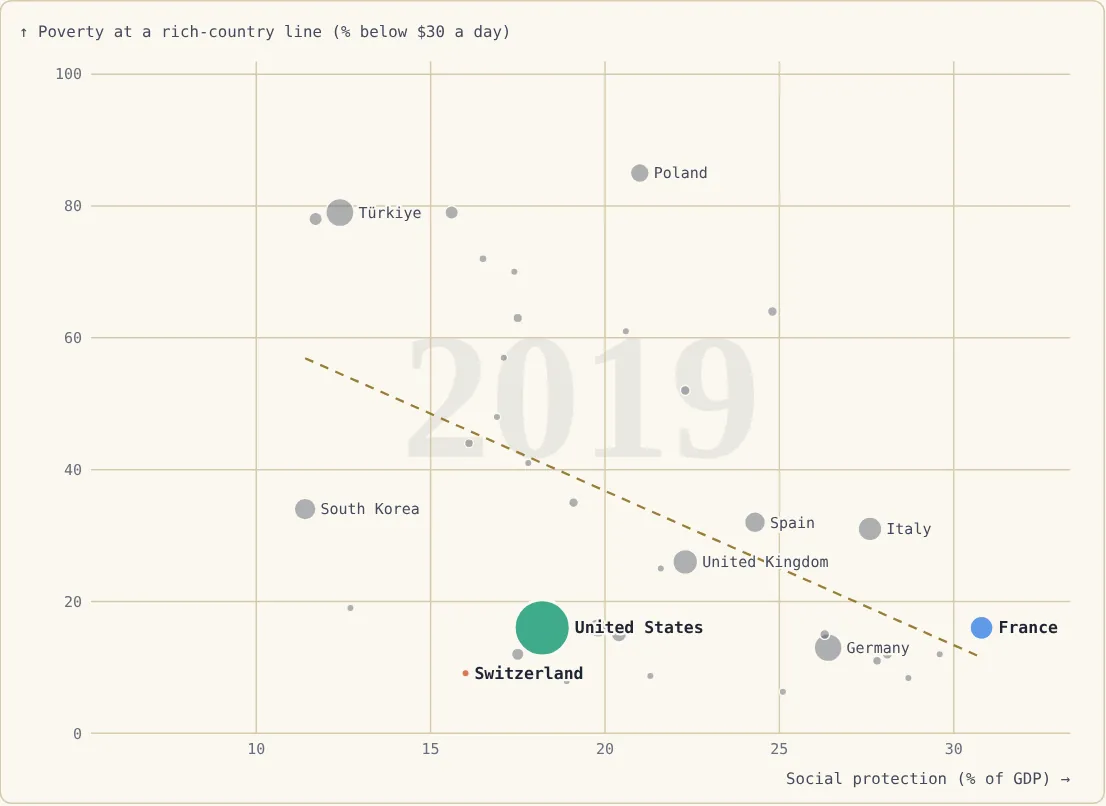
Switzerland has more relative poverty than France (19% against 16%) but less poverty at $30 a day (9% against 16%). The explanation lies in median income.
In 2019, the person "in the middle" has about $1,960 a month in Switzerland, against $1,510 in France (after taxes and benefits, in dollars adjusted for the cost of living). The relative poverty line, 60% of that income, is therefore about $39 a day in Switzerland, against $30 in France. In France the two lines almost coincide, hence the same 16%. In Switzerland, many people counted as "poor" live on between $30 and $39 a day: far from the average Swiss, but above the level at which someone is poor in France.
That higher median income comes first from work: around 2019, about 80% of 15-64-year-olds have a job in Switzerland, against about 65% in France, and unemployment is half as high (roughly 4.5% against 8.5%, according to the OECD). Low-income households there live more on wages and less on benefits.
Wealth is not enough, though. The United States has the same median income as Switzerland, and so the same $39-a-day relative line, but 16% of its population lives below $30, almost twice the Swiss share: the bottom of the ladder is much further from the middle (Gini of 41 against 33). Switzerland combines a high median income and a moderate gap between the bottom and the middle.
In the Similarities tool, the "Economic freedom → / redistribution ↑" example lets you colour countries by either kind of poverty and see where they fall.
Spend more, or spend better?
France is the rich country that spends most: 55% of its GDP in public spending in 2019. It does not get better results than countries that spend less. The Netherlands spends 42% of GDP and has about the same relative poverty (15% against 16%), less poverty at $30 a day (12% against 16%) and a higher median income. Denmark spends a little less than France (50%) and has clearly fewer poor people on both measures. Switzerland, at 32%, has fewer truly deprived people.
In other words, for the same spending, results vary a lot, and a unit of public money is not equally effective everywhere. Economists who have compared the efficiency of public sectors (António Afonso, Ludger Schuknecht and Vito Tanzi, 2005) find that countries with leaner public sectors achieve as much for less, on average. And surveys of the literature (Andreas Bergh and Magnus Henrekson, 2011) conclude that, in rich countries, a bigger state goes with slightly slower growth: roughly 0.5 to 1 point a year for every 10 extra points of GDP in spending. The site's data point the same way, but weakly: between 1995 and 2019, among 25 already-rich countries, those that spent most grew a little more slowly (r ≈ −0.23).
The link is not automatic: the Nordic countries have big states and remain among the richest and least poor in the world. But poorly targeted spending has to be paid for with higher taxes or more debt, which weighs on jobs and growth, and so in the end on everyone's income, the poorest included.
Twelve rich countries in 2019
Countries are ordered from the biggest state (low score on "size of government") to the smallest (high score).
| Country | Econ. freedom (0-10) | Size-of-government area (high = light state) | Public spending (% GDP) | Gini | Relative poverty | Below $30/day | GDP per person |
|---|---|---|---|---|---|---|---|
| Finland | 7.9 | 5.1 | 53% | 27.3 | 13% | 12% | $56,900 |
| Netherlands | 8.0 | 5.1 | 42% | 28.1 | 15% | 12% | $67,800 |
| France | 7.6 | 5.2 | 55% | 32.4 | 16% | 16% | $53,400 |
| Denmark | 8.1 | 5.3 | 50% | 28.2 | 11% | 8% | $66,600 |
| Italy | 7.5 | 5.6 | 48% | 35.9 | 22% | 31% | $49,700 |
| Germany | 8.0 | 6.0 | 46% | 31.9 | 17% | 13% | $63,000 |
| Spain | 7.8 | 6.4 | 42% | 34.7 | 22% | 32% | $46,900 |
| United Kingdom | 8.2 | 6.5 | 39% | 36.0 | 21% | 26% | $52,600 |
| Ireland | 8.3 | 6.6 | 24% | 31.4 | 14% | 19% | $96,400 |
| Estonia | 8.1 | 6.6 | 39% | 30.3 | 15% | 41% | $42,700 |
| United States | 8.3 | 7.5 | 36% | 41.4 | 25% | 16% | $69,100 |
| Switzerland | 8.3 | 7.7 | 32% | 33.1 | 19% | 9% | $79,600 |
Going down the table, the state gets lighter and relative poverty tends to rise, with clear exceptions: Ireland and Estonia have a light state and little relative poverty, Italy a heavy state and a lot of it. Poverty at $30 a day does not follow the size of the state: it is low both in Denmark (big state) and in Switzerland (small state), and high in Italy as well as in Spain or Estonia, where median income is lower. Ireland's GDP is inflated by multinationals' profits and overstates its residents' living standards.
Conclusion
The title asked three questions; the figures give three different answers.
Freer markets, richer? Yes. It is one of the clearest links between countries, and reforms have a visible effect, especially in countries that start far behind. What makes countries rich is first a reliable legal system, stable money and open trade. The size of the state, by contrast, does not separate rich countries: you can be very rich with a light state like Switzerland's or a heavy one like Norway's.
Freer markets, more unequal? Not in general. The Nordic countries and the Netherlands are among both the freest and the least unequal. Inequality follows only one area of economic freedom: a small state, that is, little redistribution.
Freer markets, more poor people? It depends on the kind of poverty. A small state has more relatively poor people, further from the income of the middle. But real poverty, in purchasing-power terms, falls mainly with a high median income, driven by employment, and with a bottom of the ladder not too far from the middle. Switzerland has both; the United States only the first.
In other words, "market versus state" is the wrong question. The countries that do best combine free markets, solid courts and social protection, public or mandatory. The real question is less the amount of public spending than its efficiency: France spends more than all the others for results that are no better, while the Netherlands, Denmark or Switzerland achieve as much or more with less. Every point of GDP spent without results has to be paid for in taxes or debt, and that is where the free-market critique of the state draws its strength.
Limits
A correlation between countries does not prove that a given reform will have the same effect everywhere. Fraser scores rely partly on expert surveys. Poverty figures come from surveys carried out in different years in different countries and are rounded. Social protection is public spending (OECD SOCX) and ignores mandatory private protection, which understates Switzerland and the Netherlands. Finally, the Gini measures income, not wealth, which is far more unequally distributed everywhere.
Sources
- Fraser Institute, Economic Freedom of the World (overall score and five areas).
- Gapminder (GDP per person); World Bank, Poverty and Inequality Platform, via Our World in Data (Gini, median income, relative poverty, poverty at $30 a day); IMF (public spending).
- OECD, Social Expenditure Database (SOCX); OECD, Income Distribution Database (inequality before and after redistribution); OECD employment statistics.
- J. de Haan and J.-E. Sturm, "On the relationship between economic freedom and economic growth", European Journal of Political Economy, 2000; J. de Haan, S. Lundström and J.-E. Sturm, "Market-oriented institutions and policies and economic growth: a critical survey", Journal of Economic Surveys, 2006.
- A. Afonso, L. Schuknecht and V. Tanzi, "Public sector efficiency: an international comparison", Public Choice, 2005.
- A. Bergh and M. Henrekson, "Government size and growth: a survey and interpretation of the evidence", Journal of Economic Surveys, 2011.