Development index (summary of 18 indicators)
A single score summarising 18 indicators of the site (wealth, health, demography, democracy, corruption, rule of law, inequality, taxes, spending…), computed by principal component analysis. The higher it is, the more “developed” the country in the broad sense.
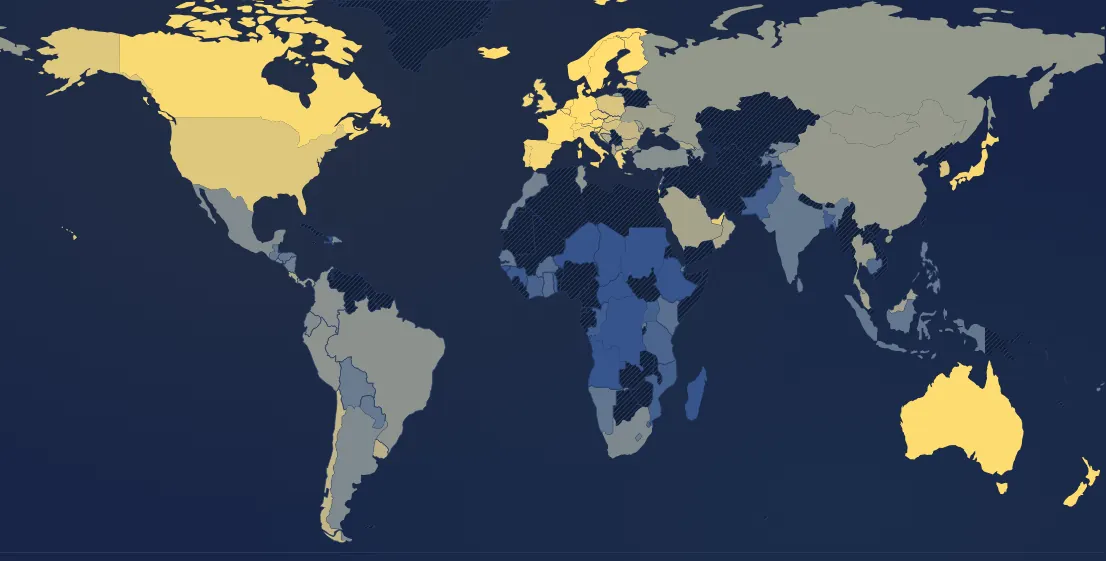
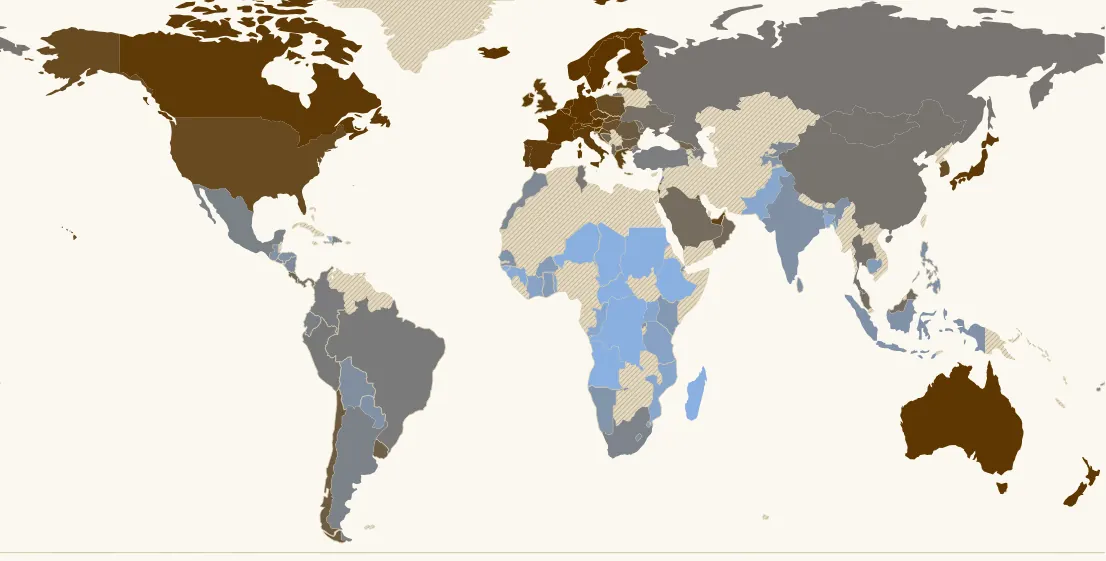
In 2021, 109 countries have a value. Highest: Luxembourg (+5.8), Finland (+5.1), Belgium (+5). Lowest: Central African Republic (−6.9), Sudan (−6.7), Chad (−6.7). France: +4.4 (11th of 109).
Country ranking in 2021
| Rank | Country | Value |
|---|---|---|
| 1 | Luxembourg | +5.8 |
| 2 | Finland | +5.1 |
| 3 | Belgium | +5 |
| 4 | Denmark | +5 |
| 5 | Sweden its history → | +5 |
| 6 | Austria | +5 |
| 7 | Netherlands its history → | +4.8 |
| 8 | Norway | +4.7 |
| 9 | Iceland | +4.6 |
| 10 | Germany its history → | +4.6 |
| 11 | France its history → | +4.4 |
| 12 | New Zealand | +4.4 |
| 13 | Australia its history → | +4.4 |
| 14 | Slovenia | +4.3 |
| 15 | Switzerland its history → | +4.2 |
| 16 | Estonia | +4.2 |
| 17 | Canada | +4.2 |
| 18 | Japan | +4.2 |
| 19 | Ireland | +4 |
| 20 | Italy | +4 |
| 21 | Spain its history → | +4 |
| 22 | United Kingdom | +3.9 |
| 23 | Czechia | +3.8 |
| 24 | Portugal its history → | +3.7 |
| 25 | Greece | +3.7 |
| 26 | Latvia | +3.4 |
| 27 | United Arab Emirates | +3.4 |
| 28 | Croatia | +3.2 |
| 29 | Slovakia | +3.1 |
| 30 | United States | +3 |
| 31 | Israel | +3 |
| 32 | South Korea | +2.8 |
| 33 | Poland | +2.8 |
| 34 | Hungary its history → | +2.5 |
| 35 | Romania | +1.8 |
| 36 | Kuwait | +1.8 |
| 37 | Chile | +1.8 |
| 38 | Bulgaria | +1.7 |
| 39 | Uruguay | +1.4 |
| 40 | Costa Rica | +1.2 |
| 41 | North Macedonia | +1 |
| 42 | Georgia | +1 |
| 43 | Bosnia & Herzegovina | +0.9 |
| 44 | Oman | +0.8 |
| 45 | Albania | +0.8 |
| 46 | Saudi Arabia | +0.6 |
| 47 | Moldova | +0.5 |
| 48 | Malaysia | +0.4 |
| 49 | Ukraine its history → | +0.2 |
| 50 | Panama | +0 |
| 51 | Thailand | 0 |
| 52 | China | −0.1 |
| 53 | Mongolia | −0.1 |
| 54 | Russia | −0.2 |
| 55 | Tunisia | −0.4 |
| 56 | Peru | −0.5 |
| 57 | Brazil | −0.5 |
| 58 | Colombia | −0.6 |
| 59 | Azerbaijan | −0.8 |
| 60 | Türkiye | −0.8 |
| 61 | Ecuador | −1 |
| 62 | Mexico | −1 |
| 63 | Argentina its history → | −1.1 |
| 64 | El Salvador | −1.2 |
| 65 | South Africa | −1.2 |
| 66 | Dominican Republic | −1.2 |
| 67 | Fiji | −1.5 |
| 68 | Kyrgyzstan | −1.6 |
| 69 | Morocco | −1.6 |
| 70 | Nicaragua | −1.8 |
| 71 | Lesotho | −2 |
| 72 | Bolivia | −2 |
| 73 | Sri Lanka | −2.2 |
| 74 | Philippines | −2.2 |
| 75 | India its history → | −2.2 |
| 76 | Guatemala | −2.2 |
| 77 | Honduras | −2.3 |
| 78 | Paraguay | −2.3 |
| 79 | Indonesia | −2.3 |
| 80 | Lebanon | −2.3 |
| 81 | Rwanda | −2.4 |
| 82 | Tajikistan | −2.4 |
| 83 | Djibouti | −2.4 |
| 84 | Senegal | −2.4 |
| 85 | Namibia | −2.4 |
| 86 | Kenya | −2.8 |
| 87 | Cambodia | −3 |
| 88 | Ghana | −3.1 |
| 89 | Burkina Faso | −3.1 |
| 90 | Eswatini | −3.5 |
| 91 | Tanzania | −3.7 |
| 92 | Côte d’Ivoire | −3.7 |
| 93 | Mozambique | −4.1 |
| 94 | Togo | −4.1 |
| 95 | Pakistan | −4.1 |
| 96 | Uganda | −4.1 |
| 97 | Bangladesh | −4.2 |
| 98 | Congo - Brazzaville | −4.4 |
| 99 | Guinea | −4.6 |
| 100 | Niger | −5 |
| 101 | Angola | −5.1 |
| 102 | Madagascar | −5.1 |
| 103 | Ethiopia | −5.2 |
| 104 | Guinea-Bissau | −5.3 |
| 105 | Haiti | −5.5 |
| 106 | Congo - Kinshasa | −6.4 |
| 107 | Chad | −6.7 |
| 108 | Sudan | −6.7 |
| 109 | Central African Republic | −6.9 |
69 countries or territories have no value that year.
Understanding this map
How these scores are obtained
We take 18 indicators of the site for the 105 countries that have all of them in 2019: GDP per person, life expectancy, child mortality, fertility, share aged 65+, democracy, corruption, the five areas of the Fraser economic freedom index, Gini index, CO₂ per person, immigrant share, trade openness, tax revenue and public spending. A principal component analysis (PCA) looks for the few “axes” that best summarise these 18 figures. The first alone summarises 62% of them: this is the development index. The second (8%) is independent of the first and contrasts small and large states (“market ↔ state” view). In other years each country is placed on the same axes, computed once and for all in 2019.
What the two axes show
The development axis runs from the Central African Republic and Chad (−6.7) to Luxembourg, Denmark and Finland (+5 to +6); France is at +4.4, close to Germany and Austria. It is very close to the UN Human Development Index, with more political criteria. The market ↔ state axis is newer: at equal development, the United States (−2.0), Chile, Ireland, Switzerland, New Zealand and Korea are on the “market” side; Belgium (+1.8), Argentina, Sweden, France (+1.4), Greece, Denmark, Norway, Finland and China (+1.0) on the “state” side. The United Kingdom (−0.6) and Germany (+0.3) are in the middle.
Stability and limits
Before publishing these indices we checked that they do not depend on a particular choice: axis 1 stays almost identical (correlation ≥ 0.99) if the axes are computed in another year (2010 to 2021) or if any one of the 18 indicators is removed; axis 2 stays close (correlation of 0.8 to 0.94 in almost all cases). The six Gulf monarchies are excluded from computing the axes, as they formed an axis of their own (“labour immigration, no democracy”); they are placed afterwards when they have the data. Only countries with all 18 indicators in a given year appear (about 110 from 2010 to 2021, fewer before). 2020-2021 spending is inflated by Covid, which pushes some countries towards “state”. An index summarises, it does not explain: the “Similarities” tool lets you redo the analysis with other indicators. Method designed for World Through Time (November 2026).
In the same theme : Wealth
All maps
Page updated on 2026-11-15.