Labour immigration (share of permanent entries)
Among immigrants who came to settle for the long term during the year, the share admitted to work (with the family accompanying the worker). The other reasons: family, asylum, European free movement.
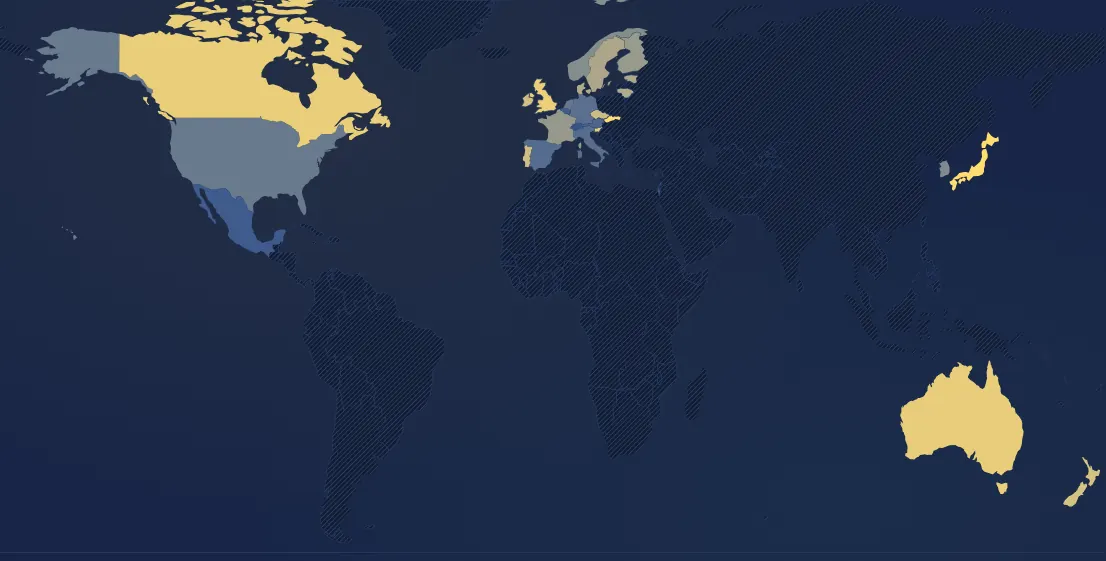
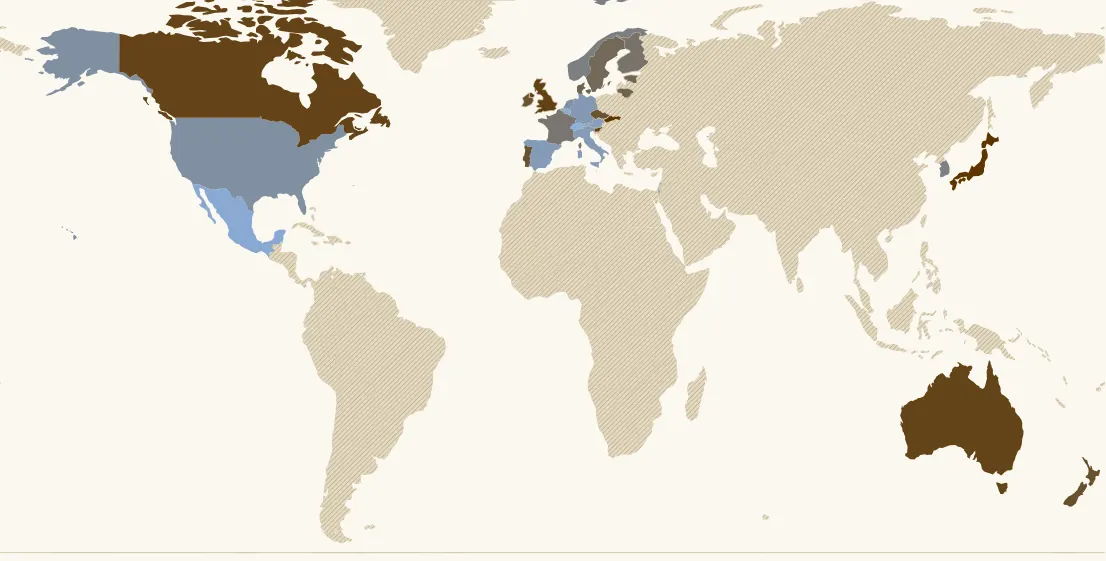
In 2024, 29 countries have a value. Highest: Japan (87 %), Slovakia (77 %), United Kingdom (60 %). Lowest: Israel (0 %), Switzerland (1.6 %), Mexico (6.5 %). France: 21 % (16th of 29).
Country ranking in 2024
| Rank | Country | Value |
|---|---|---|
| 1 | Japan | 87 % |
| 2 | Slovakia | 77 % |
| 3 | United Kingdom | 60 % |
| 4 | Slovenia | 60 % |
| 5 | Canada | 58 % |
| 6 | Australia its history → | 57 % |
| 7 | New Zealand | 46 % |
| 8 | Portugal its history → | 44 % |
| 9 | Ireland | 44 % |
| 10 | Czechia | 43 % |
| 11 | Denmark | 32 % |
| 12 | Lithuania | 32 % |
| 13 | Estonia | 30 % |
| 14 | Sweden its history → | 29 % |
| 15 | Finland | 23 % |
| 16 | France its history → | 21 % |
| 17 | Norway | 18 % |
| 18 | South Korea | 17 % |
| 19 | United States | 13 % |
| 20 | Netherlands its history → | 13 % |
| 21 | Luxembourg | 12 % |
| 22 | Germany its history → | 11 % |
| 23 | Italy | 10 % |
| 24 | Spain its history → | 9.9 % |
| 25 | Austria | 9 % |
| 26 | Belgium | 6.6 % |
| 27 | Mexico | 6.5 % |
| 28 | Switzerland its history → | 1.6 % |
| 29 | Israel | 0 % |
149 countries or territories have no value that year.
Continent averages
| Europe (average) | 24 % |
| Americas (average) | 15 % |
| Asia (average) | 63 % |
| Oceania (average) | 56 % |
Understanding this map
Why do people come to settle?
Each year the OECD classifies immigrants who came to settle for the long term by the reason for their residence permit, comparably across some thirty rich countries. Students and seasonal workers, whose stay is temporary, are not counted. In France in 2024, out of about 300,000 permanent entries: 32% family, 22% European free movement, 21% work (with accompanying family), 14% asylum, 10% other reasons.
Three models
Countries that choose immigrants through quotas or points mainly bring in workers: Japan (87% in 2024), the United Kingdom (60%), Canada (58%), Australia (57%). In the United States and Italy, family dominates (61%), as family reunification is the main route. In Western Europe, free movement weighs heavily (Switzerland 74%, Belgium 59%, Germany 47%): most of these Europeans come to work, but need no work permit, hence a very low “work” share. Asylum weighs most in Germany and Austria (22-24%) and Mexico (36%).
Limits
The reason is that of the residence permit, not actual activity: a spouse who came through family reunification may work, a worker may lose their job. Regularisations are classified by the permit obtained. Irregular migrants are not counted. To see whether immigrants work, see the “Immigrant employment” map. OECD data (International Migration Outlook), 2014-2024, some thirty countries; no world average.
Sources : OCDE, International Migration Outlook (entrées permanentes standardisées par motif)
In the same theme : Population
All maps
Page updated on 2026-11-15.