Refugees hosted
Refugees living in the country, as a share of its population: people who fled war or persecution and are recognised as refugees (or in a similar situation).
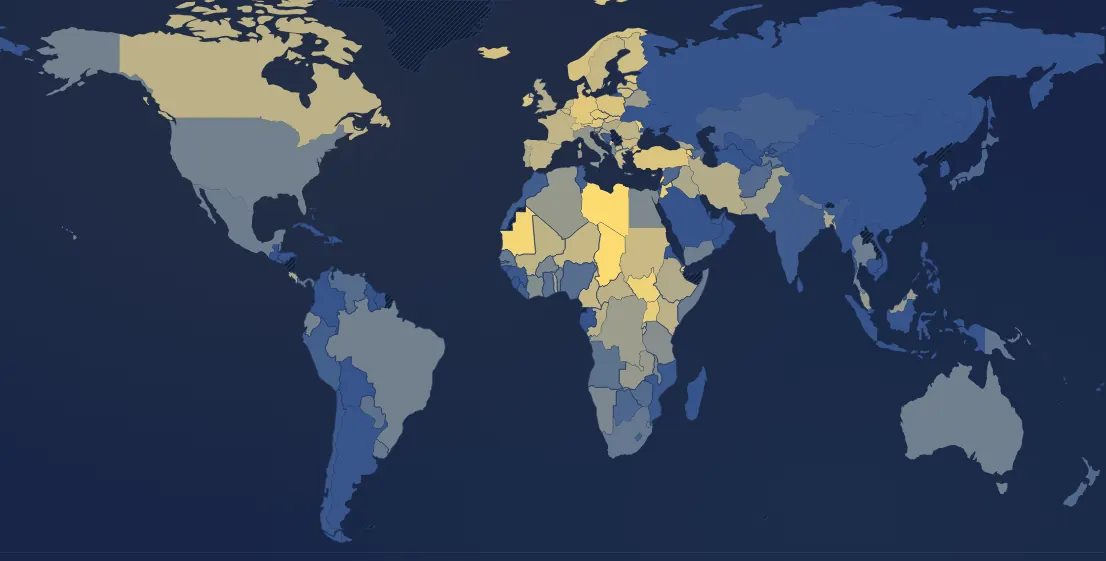
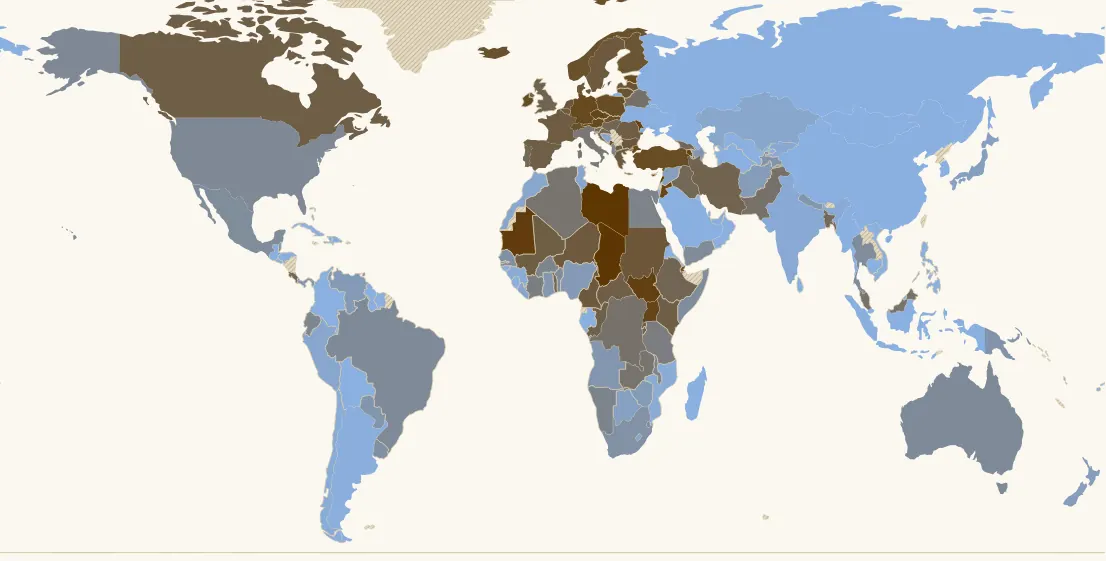
In 2025, 158 countries have a value. Highest: Lebanon (9.1 %), Libya (7.4 %), Chad (7.2 %). Lowest: Vanuatu (0 %), Vietnam (0 %), Uzbekistan (0 %). World (population-weighted average): 0.35 %. France: 1.2 % (38th of 158).
Country ranking in 2025
| Rank | Country | Value |
|---|---|---|
| 1 | Lebanon | 9.1 % |
| 2 | Libya | 7.4 % |
| 3 | Chad | 7.2 % |
| 4 | Mauritania | 5.7 % |
| 5 | Moldova | 5 % |
| 6 | South Sudan | 4.9 % |
| 7 | Armenia | 4.2 % |
| 8 | Jordan | 3.8 % |
| 9 | Uganda | 3.8 % |
| 10 | Czechia | 3.7 % |
| 11 | Cyprus | 3.5 % |
| 12 | Germany its history → | 3.2 % |
| 13 | Austria | 3.1 % |
| 14 | Estonia | 3.1 % |
| 15 | Türkiye | 2.7 % |
| 16 | Ireland | 2.6 % |
| 17 | Poland | 2.6 % |
| 18 | Slovakia | 2.6 % |
| 19 | Switzerland its history → | 2.3 % |
| 20 | Norway | 2.2 % |
| 21 | Iceland | 2.1 % |
| 22 | Djibouti | 2.1 % |
| 23 | Montenegro | 1.9 % |
| 24 | Lithuania | 1.9 % |
| 25 | Finland | 1.8 % |
| 26 | Latvia | 1.8 % |
| 27 | Belgium | 1.6 % |
| 28 | Denmark | 1.6 % |
| 29 | Bulgaria | 1.6 % |
| 30 | Sudan | 1.6 % |
| 31 | Netherlands its history → | 1.5 % |
| 32 | Malta | 1.5 % |
| 33 | Luxembourg | 1.5 % |
| 34 | Niger | 1.4 % |
| 35 | Cameroon | 1.4 % |
| 36 | Greece | 1.4 % |
| 37 | Sweden its history → | 1.4 % |
| 38 | France its history → | 1.2 % |
| 39 | North Macedonia | 1.1 % |
| 40 | Mali | 1.1 % |
| 41 | Romania | 1.1 % |
| 42 | Kenya | 1.1 % |
| 43 | Spain its history → | 1.1 % |
| 44 | Canada | 1 % |
| 45 | Central African Republic | 1 % |
| 46 | Congo - Brazzaville | 0.96 % |
| 47 | United Kingdom | 0.84 % |
| 48 | Iran | 0.83 % |
| 49 | Rwanda | 0.8 % |
| 50 | Croatia | 0.77 % |
| 51 | Burundi | 0.77 % |
| 52 | Ethiopia | 0.75 % |
| 53 | Hungary its history → | 0.74 % |
| 54 | Costa Rica | 0.71 % |
| 55 | Georgia | 0.7 % |
| 56 | Iraq | 0.69 % |
| 57 | Portugal its history → | 0.68 % |
| 58 | Bangladesh | 0.67 % |
| 59 | Togo | 0.63 % |
| 60 | Slovenia | 0.59 % |
| 61 | Pakistan | 0.45 % |
| 62 | Belarus | 0.45 % |
| 63 | Congo - Kinshasa | 0.45 % |
| 64 | Malaysia | 0.42 % |
| 65 | Algeria | 0.38 % |
| 66 | Zambia | 0.38 % |
| 67 | Italy | 0.33 % |
| 68 | Tanzania | 0.24 % |
| 69 | Côte d’Ivoire | 0.23 % |
| 70 | Egypt | 0.19 % |
| 71 | Namibia | 0.18 % |
| 72 | Burkina Faso | 0.17 % |
| 73 | Albania | 0.17 % |
| 74 | Malawi | 0.16 % |
| 75 | Gambia | 0.15 % |
| 76 | Ecuador | 0.14 % |
| 77 | United States | 0.13 % |
| 78 | Brazil | 0.13 % |
| 79 | Australia its history → | 0.12 % |
| 80 | Trinidad & Tobago | 0.12 % |
| 81 | Yemen | 0.12 % |
| 82 | Thailand | 0.12 % |
| 83 | Benin | 0.12 % |
| 84 | Mexico | 0.12 % |
| 85 | Eswatini | 0.11 % |
| 86 | Somalia | 0.11 % |
| 87 | Uruguay | 0.094 % |
| 88 | Senegal | 0.091 % |
| 89 | South Africa | 0.085 % |
| 90 | Belize | 0.082 % |
| 91 | Tajikistan | 0.08 % |
| 92 | Papua New Guinea | 0.072 % |
| 93 | Nepal | 0.066 % |
| 94 | Paraguay | 0.066 % |
| 95 | Angola | 0.065 % |
| 96 | Azerbaijan | 0.061 % |
| 97 | Ghana | 0.06 % |
| 98 | Panama | 0.059 % |
| 99 | Nigeria | 0.052 % |
| 100 | Zimbabwe | 0.051 % |
| 101 | Venezuela | 0.05 % |
| 102 | Afghanistan | 0.048 % |
| 103 | New Zealand | 0.041 % |
| 104 | Syria | 0.039 % |
| 105 | Japan | 0.034 % |
| 106 | Botswana | 0.033 % |
| 107 | Kazakhstan | 0.021 % |
| 108 | Liberia | 0.02 % |
| 109 | Lesotho | 0.02 % |
| 110 | Peru | 0.02 % |
| 111 | Bosnia & Herzegovina | 0.019 % |
| 112 | Morocco | 0.019 % |
| 113 | Tunisia | 0.019 % |
| 114 | India its history → | 0.016 % |
| 115 | Kyrgyzstan | 0.016 % |
| 116 | Guinea | 0.014 % |
| 117 | Mozambique | 0.014 % |
| 118 | Chile | 0.013 % |
| 119 | Israel | 0.013 % |
| 120 | United Arab Emirates | 0.012 % |
| 121 | Argentina its history → | 0.011 % |
| 122 | Bolivia | 0.009 % |
| 123 | South Korea | 0.009 % |
| 124 | Guatemala | 0.008 % |
| 125 | Kuwait | 0.008 % |
| 126 | Russia | 0.008 % |
| 127 | Gabon | 0.006 % |
| 128 | Qatar | 0.006 % |
| 129 | Ukraine its history → | 0.006 % |
| 130 | Oman | 0.005 % |
| 131 | Guyana | 0.004 % |
| 132 | Suriname | 0.004 % |
| 133 | Colombia | 0.003 % |
| 134 | Eritrea | 0.003 % |
| 135 | Indonesia | 0.003 % |
| 136 | El Salvador | 0.003 % |
| 137 | Bahamas | 0.002 % |
| 138 | Fiji | 0.002 % |
| 139 | Honduras | 0.002 % |
| 140 | Cuba | 0.001 % |
| 141 | Guinea-Bissau | 0.001 % |
| 142 | Sri Lanka | 0.001 % |
| 143 | Philippines | 0.001 % |
| 144 | Saudi Arabia | 0.001 % |
| 145 | Brunei | 0 % |
| 146 | China | 0 % |
| 147 | Dominican Republic | 0 % |
| 148 | Haiti | 0 % |
| 149 | Cambodia | 0 % |
| 150 | Madagascar | 0 % |
| 151 | Myanmar (Burma) | 0 % |
| 152 | Mongolia | 0 % |
| 153 | Singapore | 0 % |
| 154 | Sierra Leone | 0 % |
| 155 | Turkmenistan | 0 % |
| 156 | Uzbekistan | 0 % |
| 157 | Vietnam | 0 % |
| 158 | Vanuatu | 0 % |
20 countries or territories have no value that year.
Continent averages
| World (population-weighted average) | 0.35 % |
| Europe (average) | 1.4 % |
| Africa (average) | 0.68 % |
| Americas (average) | 0.14 % |
| Asia (average) | 0.11 % |
| Oceania (average) | 0.098 % |
Understanding this map
Who is counted
These are UNHCR figures: recognised refugees and people in a similar situation, in the country hosting them. Asylum seekers awaiting a decision and people displaced within their own country are not counted. Ukrainians under temporary protection in Europe are. Venezuelans who left for Colombia or Peru, however, are classified separately by UNHCR (“other people in need of international protection”): Colombia, which hosts nearly 3 million, therefore appears close to zero here.
What it shows
Hosting falls mostly on countries next to wars: Lebanon (16.5% of its population in 2015, with Syrians; 9.1% in 2025), Jordan, Turkey (3.2% in 2015), Chad, Uganda. In Europe, Germany hosts 3.2% in 2025, Poland 2.6% (Ukrainians), Sweden 1.4%, France 1.2%, the United Kingdom 0.8%, Italy 0.3%. The world share (countries present) is around 0.35 to 0.4%.
Limits
Countries count differently: some remove refugees who became citizens, others keep them for a long time. Small values for countries hosting few are imprecise. World and continents weighted by population, only if the countries present make up at least 60% of the population.
Sources : HCR (Haut-Commissariat des Nations unies pour les réfugiés), via Our World in Data
In the same theme : Population
All maps
Page updated on 2026-11-15.