Funded pension assets
All the money set aside to pay future pensions (pension funds, pension insurance contracts, savings plans, employers' book reserves), as a share of GDP. Excluding reserves of public pay-as-you-go schemes.
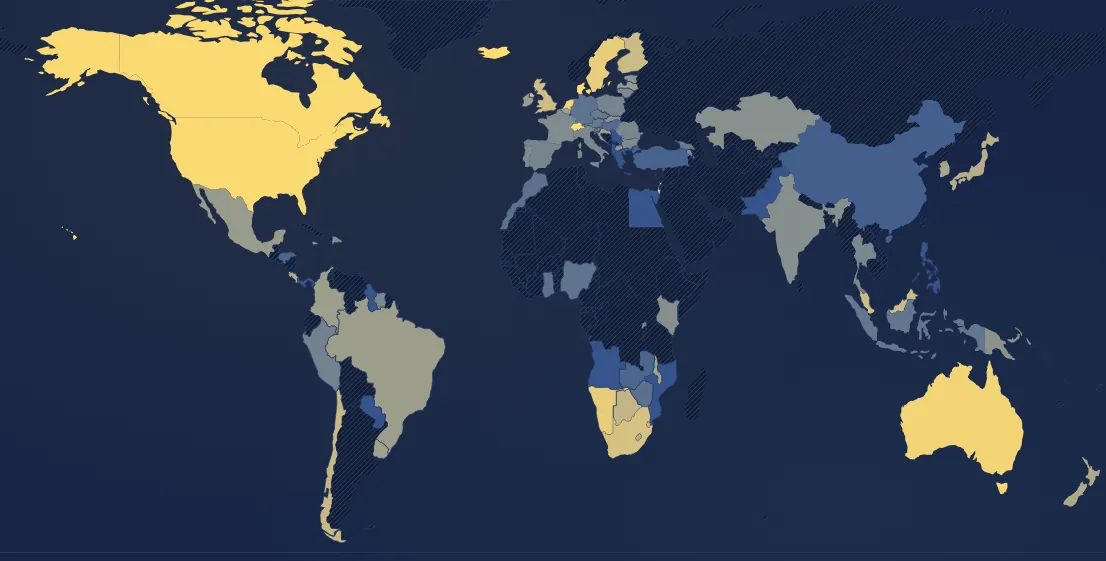
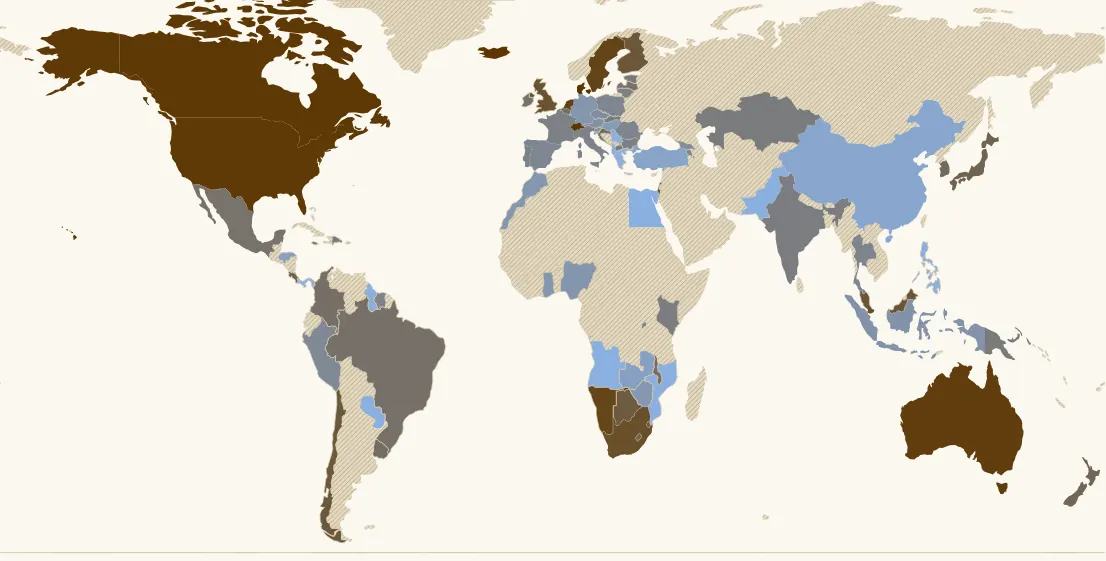
In 2025, 82 countries have a value. Highest: Denmark (202 %), Iceland (192 %), Switzerland (169 %). Lowest: Pakistan (0.1 %), Albania (0.4 %), Paraguay (0.5 %). France: 14 % (44th of 82).
Country ranking in 2025
| Rank | Country | Value |
|---|---|---|
| 1 | Denmark | 202 % |
| 2 | Iceland | 192 % |
| 3 | Switzerland its history → | 169 % |
| 4 | Canada | 166 % |
| 5 | United States | 161 % |
| 6 | Australia its history → | 143 % |
| 7 | Netherlands its history → | 139 % |
| 8 | Sweden its history → | 119 % |
| 9 | Namibia | 114 % |
| 10 | South Africa | 84 % |
| 11 | Singapore | 84 % |
| 12 | Israel | 76 % |
| 13 | United Kingdom | 74 % |
| 14 | Malaysia | 70 % |
| 15 | Finland | 67 % |
| 16 | Eswatini | 65 % |
| 17 | Chile | 64 % |
| 18 | Botswana | 58 % |
| 19 | Costa Rica | 45 % |
| 20 | Japan | 44 % |
| 21 | Lesotho | 41 % |
| 22 | New Zealand | 39 % |
| 23 | Malta | 35 % |
| 24 | South Korea | 34 % |
| 25 | Malawi | 32 % |
| 26 | Croatia | 31 % |
| 27 | Belgium | 30 % |
| 28 | Uruguay | 30 % |
| 29 | Colombia | 28 % |
| 30 | Brazil | 28 % |
| 31 | Ireland | 27 % |
| 32 | Latvia | 26 % |
| 33 | Mexico | 26 % |
| 34 | Jamaica | 24 % |
| 35 | Estonia | 20 % |
| 36 | North Macedonia | 19 % |
| 37 | Papua New Guinea | 18 % |
| 38 | Slovakia | 18 % |
| 39 | Kazakhstan | 17 % |
| 40 | Dominican Republic | 17 % |
| 41 | Kenya | 16 % |
| 42 | India its history → | 16 % |
| 43 | Bulgaria | 14 % |
| 44 | France its history → | 14 % |
| 45 | Lithuania | 13 % |
| 46 | Portugal its history → | 13 % |
| 47 | Armenia | 13 % |
| 48 | Rwanda | 12 % |
| 49 | Italy | 12 % |
| 50 | Suriname | 12 % |
| 51 | Thailand | 11 % |
| 52 | Romania | 11 % |
| 53 | Poland | 11 % |
| 54 | Spain its history → | 10 % |
| 55 | Peru | 9.5 % |
| 56 | Georgia | 7.9 % |
| 57 | Czechia | 7.9 % |
| 58 | Slovenia | 7.3 % |
| 59 | Austria | 7.2 % |
| 60 | Indonesia | 6.7 % |
| 61 | Nigeria | 6.2 % |
| 62 | Germany its history → | 6.2 % |
| 63 | Morocco | 5.8 % |
| 64 | Zimbabwe | 5.8 % |
| 65 | Ghana | 5.7 % |
| 66 | Hungary its history → | 4.8 % |
| 67 | Honduras | 4.1 % |
| 68 | Zambia | 3.9 % |
| 69 | Türkiye | 3.4 % |
| 70 | China | 3 % |
| 71 | Guyana | 2.1 % |
| 72 | Mozambique | 1.4 % |
| 73 | Luxembourg | 1.4 % |
| 74 | Greece | 1.3 % |
| 75 | Egypt | 1.1 % |
| 76 | Panama | 0.9 % |
| 77 | Angola | 0.9 % |
| 78 | Philippines | 0.8 % |
| 79 | Serbia | 0.6 % |
| 80 | Paraguay | 0.5 % |
| 81 | Albania | 0.4 % |
| 82 | Pakistan | 0.1 % |
96 countries or territories have no value that year.
Continent averages
| Europe (average) | 27 % |
| Africa (average) | 14 % |
| Americas (average) | 85 % |
| Asia (average) | 11 % |
| Oceania (average) | 99 % |
Understanding this map
Two ways to pay pensions
Under pay-as-you-go, contributions from workers pay the pensions of that year's retirees; under funding, each person (or their employer) saves during working life, and the invested savings pay their pension. Almost all countries mix the two. In 2025 pension savings exceed 100% of GDP in Denmark (201%), Iceland (191%), Switzerland (169%), Canada (166%), the United States (161%), Australia (143%), the Netherlands (139%) and Sweden (118%). They are small where pay-as-you-go dominates: France 13%, Italy 12%, Spain 10%, Germany 6%, Greece 1%.
And public debt?
One might think funding protects against debt, since the state pays less in pensions. The figures do not show it: across countries there is no link between pension savings and public debt (r ≈ 0 in 2024, rich countries included). The United States, Canada or the United Kingdom fund heavily and are highly indebted; Eastern Europe funds little and has little debt. The link appears only in Western Europe (Denmark, Switzerland, the Netherlands against France, Italy, Greece). Countries that fund heavily spend somewhat less on public pensions (r ≈ −0.25), but debt depends on many other things. Conversely, in 2014 Poland transferred half of private pension savings to the state (from 19% to 10% of GDP), which cut its debt from 57% to 51% of GDP, on paper.
Limits
OECD funded pensions database (Global Pension Statistics), all vehicles and all plans, mandatory or voluntary. Public reserves (France's pension reserve fund, Japan's public fund, Norway's oil fund) are not counted. Amounts follow financial markets: the 2022 drop (Netherlands from 206% to 145% of GDP) comes mainly from falling bond prices. Gaps of five years or less are interpolated, and the last value is carried forward two years at most.
Sources : OCDE, Global Pension Statistics (retraite par capitalisation)
In the same theme : Public finances
All maps
Page updated on 2026-11-15.