Immigrant inflows
Foreigners who came to settle in the country during the year, as a share of its population. OECD countries only; each country counts in its own way.
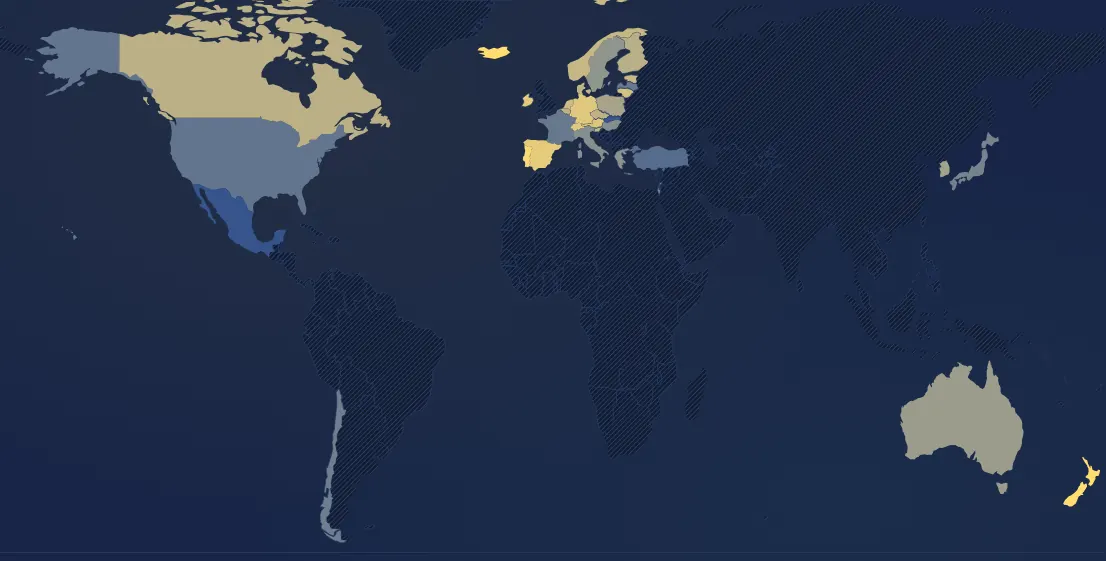
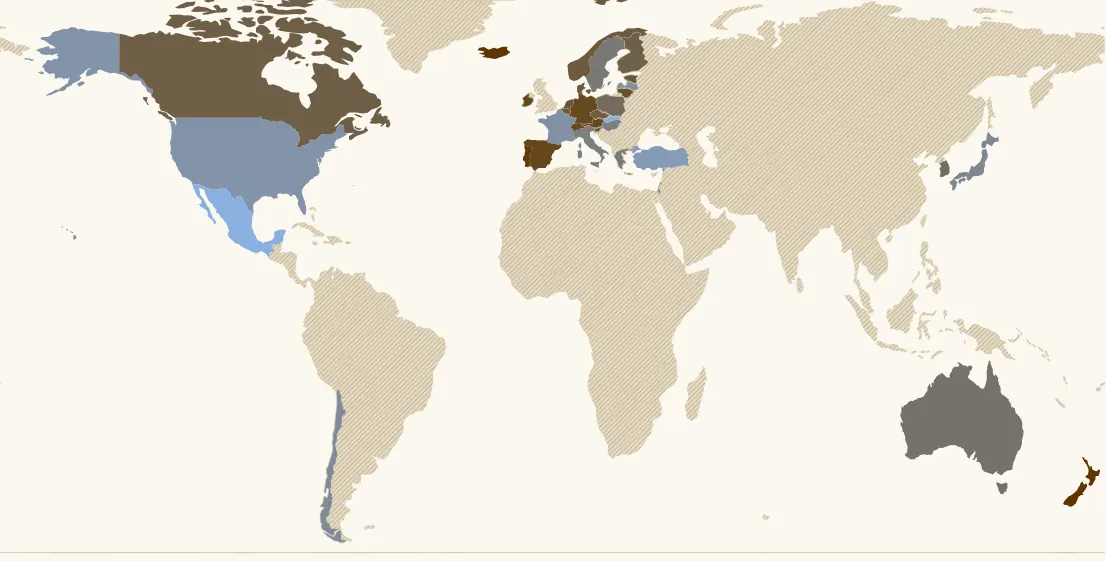
In 2023, 35 countries have a value. Highest: Iceland (4.29 %), New Zealand (4.01 %), Luxembourg (3.78 %). Lowest: Slovakia (0.04 %), Mexico (0.05 %), Türkiye (0.25 %). France: 0.39 % (31st of 35).
Country ranking in 2023
| Rank | Country | Value |
|---|---|---|
| 1 | Iceland | 4.29 % |
| 2 | New Zealand | 4.01 % |
| 3 | Luxembourg | 3.78 % |
| 4 | Portugal its history → | 3.15 % |
| 5 | Spain its history → | 2.29 % |
| 6 | Ireland | 2.16 % |
| 7 | Germany its history → | 2.06 % |
| 8 | Switzerland its history → | 2.05 % |
| 9 | Austria | 1.99 % |
| 10 | Lithuania | 1.76 % |
| 11 | Netherlands its history → | 1.61 % |
| 12 | Estonia | 1.51 % |
| 13 | Norway | 1.44 % |
| 14 | Slovenia | 1.41 % |
| 15 | Denmark | 1.33 % |
| 16 | Belgium | 1.31 % |
| 17 | Czechia | 1.29 % |
| 18 | Canada | 1.2 % |
| 19 | Finland | 1.18 % |
| 20 | Poland | 0.97 % |
| 21 | South Korea | 0.93 % |
| 22 | Australia its history → | 0.83 % |
| 23 | Sweden its history → | 0.73 % |
| 24 | Greece | 0.7 % |
| 25 | Italy | 0.64 % |
| 26 | Hungary its history → | 0.63 % |
| 27 | Israel | 0.5 % |
| 28 | Japan | 0.5 % |
| 29 | Chile | 0.45 % |
| 30 | Latvia | 0.4 % |
| 31 | France its history → | 0.39 % |
| 32 | United States | 0.35 % |
| 33 | Türkiye | 0.25 % |
| 34 | Mexico | 0.05 % |
| 35 | Slovakia | 0.04 % |
143 countries or territories have no value that year.
Continent averages
| Europe (average) | 1.37 % |
Understanding this map
Inflows and net migration
This map counts only arrivals of foreigners. Net migration, next to it, also subtracts departures (including of nationals): a country can receive many immigrants and have a small balance if many people leave. France receives about 260,000 foreigners in 2023 (0.39% of its population) for a net balance of about +93,000; Germany 1.74 million (2.1%) for a balance of about +600,000.
Careful with comparisons
The OECD gathers national figures without harmonising them. Many countries (Germany, Austria, the Netherlands, the Nordic countries, Spain, Japan, Korea…) count all registrations in the population register, temporary stays included (workers for a few months, students). Others only count longer-term residence permits: France, for instance, only counts nationals of non-EU countries receiving a residence permit, not Europeans; the United States counts new green cards. Both therefore look lower than they would under the German method. Very small figures (Slovakia, Mexico) reflect a narrow definition. Above all, compare a country with itself over time, while being wary of sudden one-year jumps (France 2006 and 2013, for instance): they often reflect a change in counting, which the OECD file does not flag. Series run from 1995 to 2023 depending on the country (about thirty countries before 2005).
What it shows
In 2023 the highest inflows relative to population are in Iceland (4.3%), New Zealand (4%), Luxembourg, Portugal (3.2%), Spain (2.3%), Ireland, Germany and Switzerland (about 2%). Peaks stand out: Germany 2015 (2 million, Syrian refugees) and 2022 (2.5 million, Ukrainians). The 2020 drop is Covid. Only recorded legal entries are counted.
Sources : OCDE, International Migration Database (entrées de population étrangère)
In the same theme : Population
All maps
Page updated on 2026-11-15.