Homicide rate
Number of people intentionally killed in a year, per 100,000 people: murders, excluding wars and self-defence.
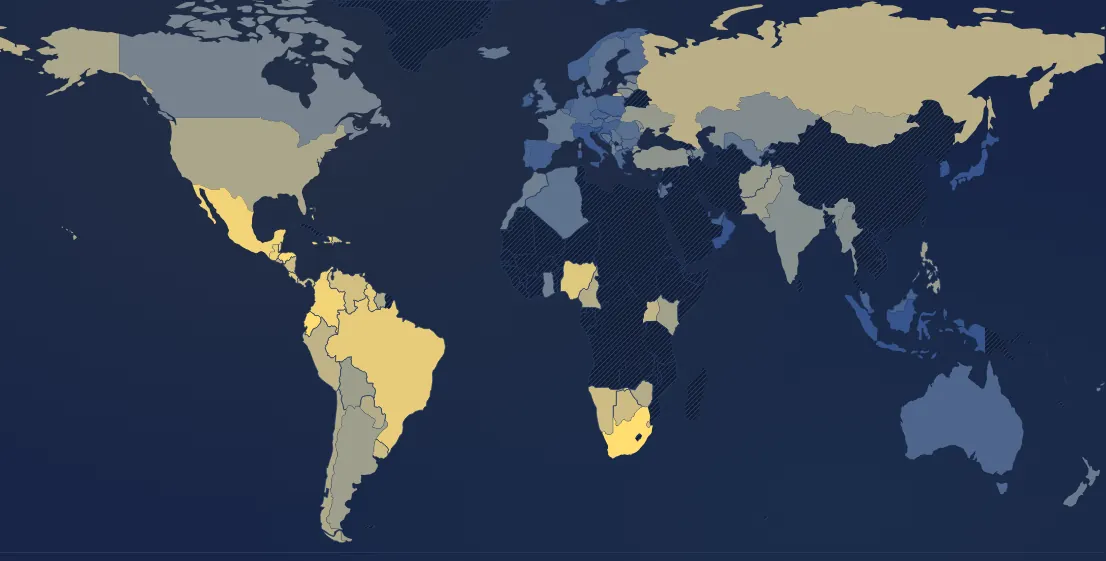
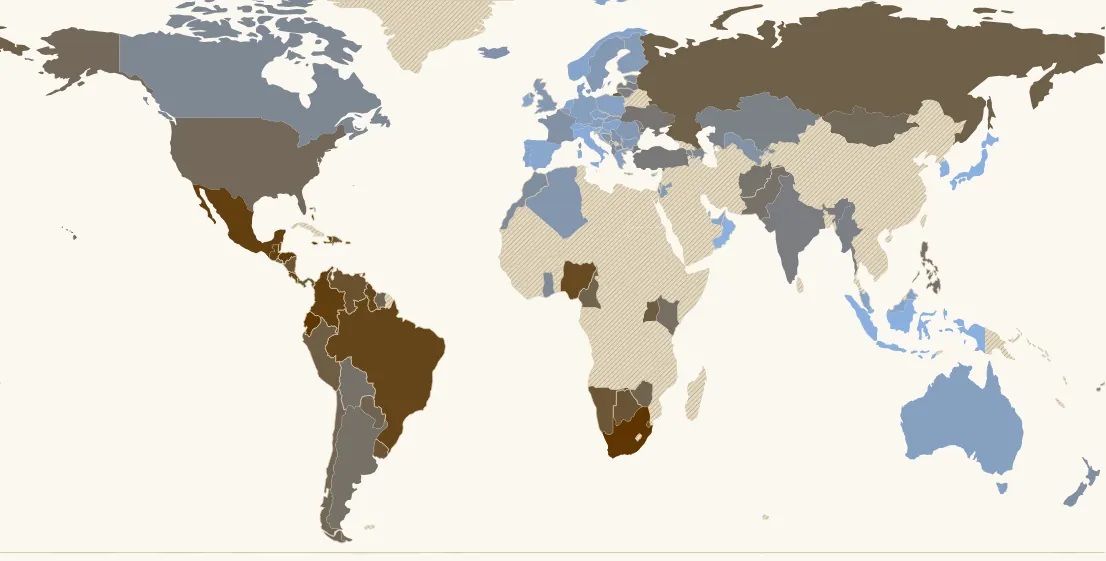
In 2024, 105 countries have a value. Highest: Jamaica (49 per 100,000), Ecuador (46 per 100,000), South Africa (44 per 100,000). Lowest: Singapore (0.1 per 100,000), Qatar (0.1 per 100,000), Oman (0.1 per 100,000). World: 5.1 per 100,000. France: 1.4 per 100,000 (63rd of 105).
Country ranking in 2024
| Rank | Country | Value |
|---|---|---|
| 1 | Jamaica | 49 per 100,000 |
| 2 | Ecuador | 46 per 100,000 |
| 3 | South Africa | 44 per 100,000 |
| 4 | Haiti | 41 per 100,000 |
| 5 | Trinidad & Tobago | 40 per 100,000 |
| 6 | Bahamas | 32 per 100,000 |
| 7 | Honduras | 31 per 100,000 |
| 8 | Belize | 28 per 100,000 |
| 9 | Colombia | 25 per 100,000 |
| 10 | Mexico | 25 per 100,000 |
| 11 | Guatemala | 23 per 100,000 |
| 12 | Brazil | 19 per 100,000 |
| 13 | Guyana | 19 per 100,000 |
| 14 | Costa Rica | 18 per 100,000 |
| 15 | Nigeria | 16 per 100,000 |
| 16 | Puerto Rico | 15 per 100,000 |
| 17 | Venezuela | 13 per 100,000 |
| 18 | Eswatini | 13 per 100,000 |
| 19 | Panama | 12 per 100,000 |
| 20 | Botswana | 11 per 100,000 |
| 21 | Nicaragua | 11 per 100,000 |
| 22 | Namibia | 11 per 100,000 |
| 23 | Uruguay | 11 per 100,000 |
| 24 | Dominican Republic | 11 per 100,000 |
| 25 | Uganda | 9 per 100,000 |
| 26 | Peru | 8.6 per 100,000 |
| 27 | El Salvador | 7.9 per 100,000 |
| 28 | Russia | 7.8 per 100,000 |
| 29 | Cameroon | 6.8 per 100,000 |
| 30 | Paraguay | 6.8 per 100,000 |
| 31 | Zimbabwe | 6.8 per 100,000 |
| 32 | Suriname | 6.5 per 100,000 |
| 33 | Chile | 6.3 per 100,000 |
| 34 | Bermuda | 6.2 per 100,000 |
| 35 | United States | 5.8 per 100,000 |
| 36 | Mongolia | 5.6 per 100,000 |
| 37 | Kenya | 4.9 per 100,000 |
| 38 | Argentina its history → | 4.5 per 100,000 |
| 39 | Bolivia | 4.4 per 100,000 |
| 40 | Pakistan | 4.3 per 100,000 |
| 41 | Philippines | 4.3 per 100,000 |
| 42 | Afghanistan | 4 per 100,000 |
| 43 | Ukraine its history → | 3.8 per 100,000 |
| 44 | Türkiye | 3.2 per 100,000 |
| 45 | India its history → | 2.8 per 100,000 |
| 46 | Lithuania | 2.6 per 100,000 |
| 47 | Myanmar (Burma) | 2.6 per 100,000 |
| 48 | Kazakhstan | 2.5 per 100,000 |
| 49 | Latvia | 2.5 per 100,000 |
| 50 | Moldova | 2.5 per 100,000 |
| 51 | Armenia | 2.2 per 100,000 |
| 52 | Fiji | 2.1 per 100,000 |
| 53 | Azerbaijan | 2 per 100,000 |
| 54 | Canada | 2 per 100,000 |
| 55 | Albania | 1.8 per 100,000 |
| 56 | Ghana | 1.8 per 100,000 |
| 57 | Morocco | 1.7 per 100,000 |
| 58 | Israel | 1.6 per 100,000 |
| 59 | Estonia | 1.5 per 100,000 |
| 60 | Luxembourg | 1.5 per 100,000 |
| 61 | North Macedonia | 1.5 per 100,000 |
| 62 | New Zealand | 1.5 per 100,000 |
| 63 | France its history → | 1.4 per 100,000 |
| 64 | Uzbekistan | 1.4 per 100,000 |
| 65 | Iceland | 1.3 per 100,000 |
| 66 | Serbia | 1.3 per 100,000 |
| 67 | Bosnia & Herzegovina | 1.2 per 100,000 |
| 68 | Algeria | 1.2 per 100,000 |
| 69 | Belgium | 1.1 per 100,000 |
| 70 | Bulgaria | 1.1 per 100,000 |
| 71 | United Kingdom | 1.1 per 100,000 |
| 72 | Romania | 1.1 per 100,000 |
| 73 | Slovakia | 1.1 per 100,000 |
| 74 | Sweden its history → | 1.1 per 100,000 |
| 75 | Jordan | 1 per 100,000 |
| 76 | Finland | 1 per 100,000 |
| 77 | Cyprus | 1 per 100,000 |
| 78 | Germany its history → | 0.9 per 100,000 |
| 79 | Austria | 0.9 per 100,000 |
| 80 | Australia its history → | 0.9 per 100,000 |
| 81 | Denmark | 0.8 per 100,000 |
| 82 | Greece | 0.8 per 100,000 |
| 83 | Poland | 0.8 per 100,000 |
| 84 | Montenegro | 0.8 per 100,000 |
| 85 | Czechia | 0.8 per 100,000 |
| 86 | Malaysia | 0.7 per 100,000 |
| 87 | Hungary its history → | 0.7 per 100,000 |
| 88 | Norway | 0.7 per 100,000 |
| 89 | Portugal its history → | 0.7 per 100,000 |
| 90 | United Arab Emirates | 0.7 per 100,000 |
| 91 | Spain its history → | 0.7 per 100,000 |
| 92 | Netherlands its history → | 0.7 per 100,000 |
| 93 | Croatia | 0.7 per 100,000 |
| 94 | Ireland | 0.7 per 100,000 |
| 95 | Palestine | 0.6 per 100,000 |
| 96 | Switzerland its history → | 0.6 per 100,000 |
| 97 | Italy | 0.6 per 100,000 |
| 98 | Slovenia | 0.6 per 100,000 |
| 99 | Malta | 0.6 per 100,000 |
| 100 | South Korea | 0.5 per 100,000 |
| 101 | Indonesia | 0.3 per 100,000 |
| 102 | Japan | 0.2 per 100,000 |
| 103 | Oman | 0.1 per 100,000 |
| 104 | Qatar | 0.1 per 100,000 |
| 105 | Singapore | 0.1 per 100,000 |
73 countries or territories have no value that year.
Continent averages
| World | 5.1 per 100,000 |
| Europe (average) | 2.5 per 100,000 |
| Americas (average) | 14 per 100,000 |
| Oceania (average) | 1 per 100,000 |
Understanding this map
Why homicides
To compare violence across countries, this is the most reliable figure: a homicide is almost always recorded, whereas thefts, assaults or sexual violence depend on what victims report and what each country records. It is also a good indicator of violence in general: countries with many killings are rarely safe otherwise. It does not measure the feeling of insecurity, which can move very differently.
Orders of magnitude
The world average estimated by the UN falls from 7 per 100,000 in 2000 to 5.1 in 2024. In Western Europe and East Asia it is around 0.5 to 1.5 (Japan 0.2, Italy 0.6, France 1.3). The United States is about five times higher (5.8 in 2023, after a peak of 6.5 in 2022). The highest rates are in the Caribbean, Latin America and southern Africa: Jamaica 53, South Africa 44, Honduras 35. The sharpest recent falls are spectacular: Colombia goes from 75 in 1990 to 25, El Salvador from 108 in 2015 to 8 in 2022, at the cost of a state of emergency and mass arrests. And sudden rises: Ecuador goes from 7 in 2019 to 46 in 2023.
Limits
UNODC figures, drawn from each country's police or health statistics. Some countries publish little or nothing (parts of Africa and Asia): the last value is carried forward for at most 3 years and gaps of up to 5 years are filled (“estimated between” in the tooltip). War deaths are not counted. Continent averages are weighted by population, only if reporting countries make up at least 60% of the population; the “World” line is the UN's estimate, which fills in countries without data.
Sources : ONUDC (Office des Nations unies contre la drogue et le crime), via Our World in Data
All maps
Page updated on 2026-11-15.