Public pension spending
Old-age and survivors' pensions (and services for the elderly) paid by the state and public schemes, as a share of the wealth produced (GDP).
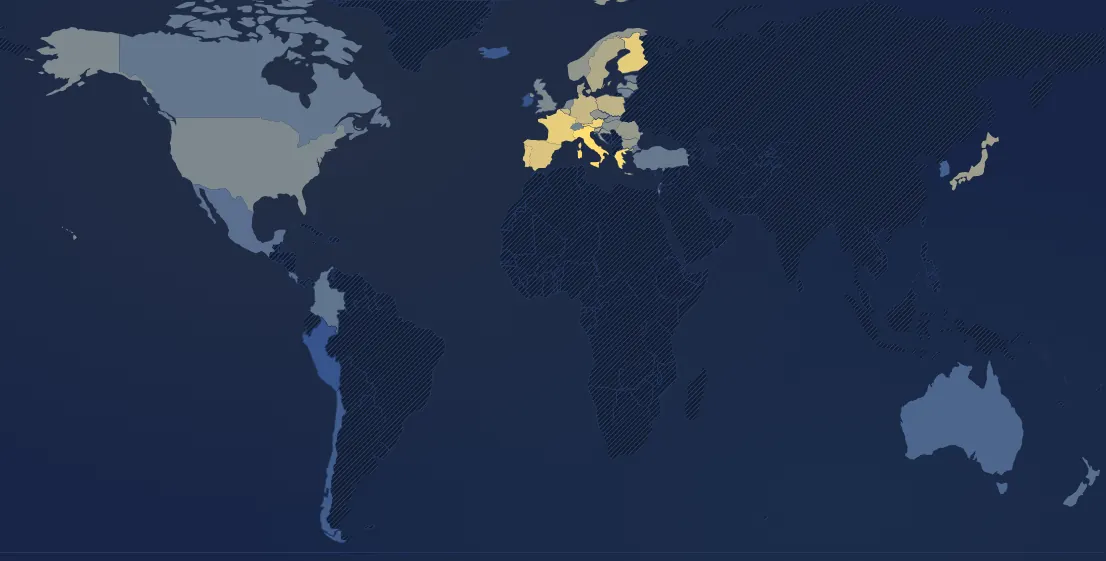
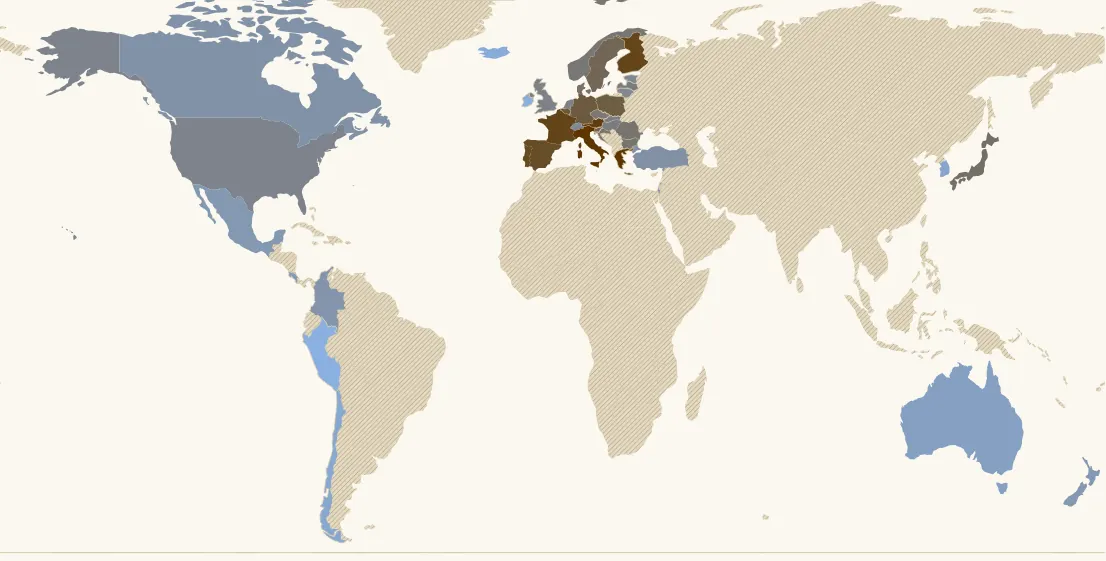
In 2023, 42 countries have a value. Highest: Italy (16.2 %), Greece (16.2 %), Austria (14.8 %). Lowest: Peru (1.9 %), Ireland (3 %), Iceland (3.3 %). France: 13.8 % (4th of 42).
Country ranking in 2023
| Rank | Country | Value |
|---|---|---|
| 1 | Italy | 16.2 % |
| 2 | Greece | 16.2 % |
| 3 | Austria | 14.8 % |
| 4 | France its history → | 13.8 % |
| 5 | Finland | 13.7 % |
| 6 | Portugal its history → | 13 % |
| 7 | Spain its history → | 12.7 % |
| 8 | Belgium | 11.7 % |
| 9 | Germany its history → | 11.6 % |
| 10 | Poland | 11.2 % |
| 11 | Slovenia | 10.7 % |
| 12 | Sweden its history → | 10.3 % |
| 13 | Japan | 9.4 % |
| 14 | Denmark | 9.3 % |
| 15 | Croatia | 9.1 % |
| 16 | Bulgaria | 8.9 % |
| 17 | Romania | 8.9 % |
| 18 | Luxembourg | 8.6 % |
| 19 | Norway | 8.6 % |
| 20 | Czechia | 8.5 % |
| 21 | Latvia | 8.1 % |
| 22 | Hungary its history → | 8.1 % |
| 23 | Slovakia | 7.9 % |
| 24 | Netherlands its history → | 7.5 % |
| 25 | United Kingdom | 7.5 % |
| 26 | United States | 7.4 % |
| 27 | Estonia | 6.9 % |
| 28 | Lithuania | 6.8 % |
| 29 | Switzerland its history → | 6.8 % |
| 30 | Türkiye | 6.1 % |
| 31 | Canada | 5.9 % |
| 32 | Colombia | 5.7 % |
| 33 | Israel | 5.4 % |
| 34 | Mexico | 5.3 % |
| 35 | New Zealand | 5.2 % |
| 36 | Costa Rica | 5 % |
| 37 | Australia its history → | 4.5 % |
| 38 | South Korea | 4 % |
| 39 | Chile | 3.7 % |
| 40 | Iceland | 3.3 % |
| 41 | Ireland | 3 % |
| 42 | Peru | 1.9 % |
136 countries or territories have no value that year.
Continent averages
| Europe (average) | 10.6 % |
| Americas (average) | 6.3 % |
| Asia (average) | 7.7 % |
| Oceania (average) | 4.6 % |
Understanding this map
The largest spending item
In most rich countries pensions are the largest public spending item. In 2021 Italy and Greece devoted 16% of GDP to them, Austria 15%, France and Finland 14%, Portugal and Spain 13%, Germany 12%. They are much lower where much of retirement income comes from mandatory savings (funded schemes): Netherlands and United Kingdom 7.5-8%, United States and Switzerland 7%, Australia 4.6%, Iceland and Chile 3%. Ireland (3%) and Korea (3.8%) are low for other reasons: an Irish GDP inflated by multinationals, a Korean scheme still young.
Pensions and public debt
The countries spending most on pensions are often the most indebted (r ≈ 0.5 across 42 countries in 2021): Italy, Greece, France, Portugal, Spain, Belgium. But much of the link comes from ageing, which drives both pension spending and other spending (health): at an equal share of people aged 65 and over, only about 0.25 remains. Compare with the “Funded savings” map and the “Pensions and debt” example in the Correlations tool.
Limits
OECD Social Expenditure Database (SOCX), “old age” and “survivors” branches, public spending only: mandatory supplementary pensions run by private bodies (Netherlands, Switzerland, Denmark…) are not included, while public or jointly run supplementary schemes (Agirc-Arrco in France) are. About forty OECD countries, 1980-2023; the last two years often repeat the 2021 figure (the tooltip says so). No world average.
Sources : OCDE, base des dépenses sociales (SOCX), vieillesse et survie, dépense publique
In the same theme : Public finances
All maps
Page updated on 2026-11-15.