Share of women in the population
The share of women among residents. Above 50%, there are more women than men; below, more men.
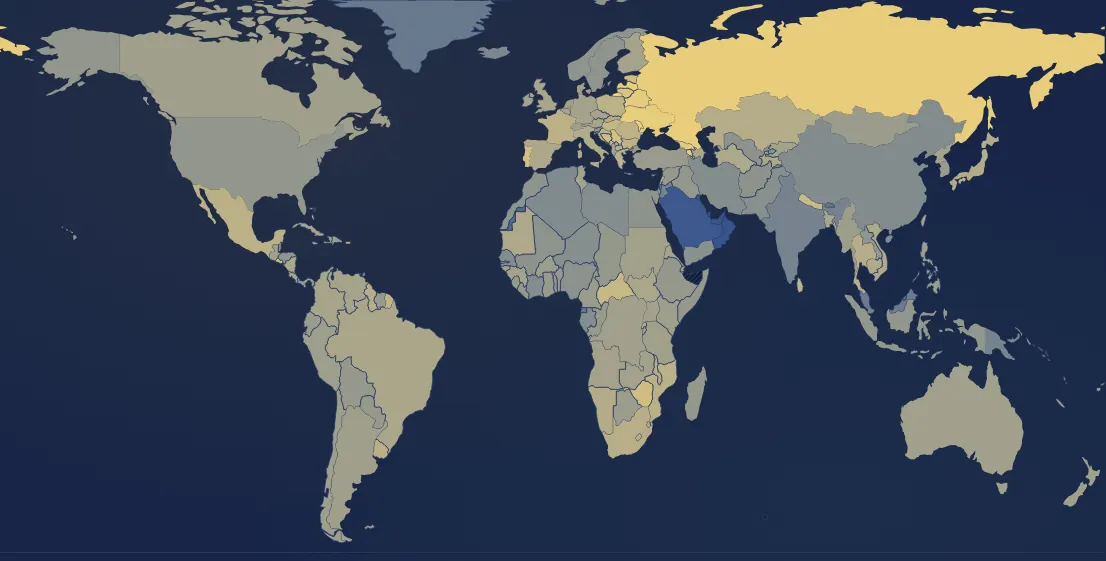
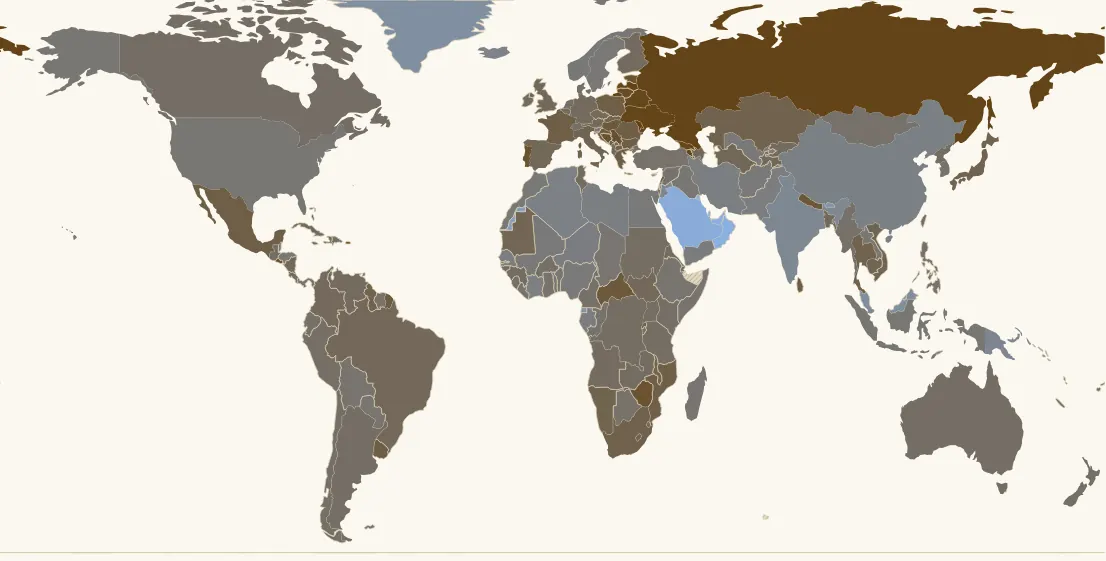
In 2024, 177 countries have a value. Highest: Moldova (54 %), Latvia (53.6 %), Russia (53.6 %). Lowest: Qatar (28.7 %), United Arab Emirates (36.1 %), Oman (37.8 %). World (population-weighted average): 49.7 %. France: 51.5 % (28th of 177).
Country ranking in 2024
| Rank | Country | Value |
|---|---|---|
| 1 | Moldova | 54 % |
| 2 | Latvia | 53.6 % |
| 3 | Russia | 53.6 % |
| 4 | Armenia | 53.6 % |
| 5 | Ukraine its history → | 53.5 % |
| 6 | Belarus | 53.4 % |
| 7 | Georgia | 53.4 % |
| 8 | Puerto Rico | 52.9 % |
| 9 | Lithuania | 52.8 % |
| 10 | Serbia | 52.6 % |
| 11 | El Salvador | 52.5 % |
| 12 | Estonia | 52.5 % |
| 13 | Bosnia & Herzegovina | 52.4 % |
| 14 | Portugal its history → | 52.4 % |
| 15 | Zimbabwe | 52.3 % |
| 16 | Bahamas | 52.3 % |
| 17 | Nepal | 52.1 % |
| 18 | Central African Republic | 52 % |
| 19 | Hungary its history → | 52 % |
| 20 | Montenegro | 51.9 % |
| 21 | French Guiana | 51.8 % |
| 22 | Croatia | 51.8 % |
| 23 | Sri Lanka | 51.6 % |
| 24 | Bulgaria | 51.6 % |
| 25 | Romania | 51.6 % |
| 26 | Greece | 51.6 % |
| 27 | Poland | 51.6 % |
| 28 | France its history → | 51.5 % |
| 29 | Mexico | 51.5 % |
| 30 | Uruguay | 51.5 % |
| 31 | Mozambique | 51.5 % |
| 32 | Lebanon | 51.4 % |
| 33 | North Macedonia | 51.4 % |
| 34 | South Africa | 51.3 % |
| 35 | Guyana | 51.3 % |
| 36 | Thailand | 51.3 % |
| 37 | Kazakhstan | 51.3 % |
| 38 | Lesotho | 51.3 % |
| 39 | Japan | 51.2 % |
| 40 | Rwanda | 51.2 % |
| 41 | Malawi | 51.2 % |
| 42 | Slovakia | 51.2 % |
| 43 | Namibia | 51.2 % |
| 44 | Italy | 51.1 % |
| 45 | Bermuda | 51.1 % |
| 46 | Vietnam | 51 % |
| 47 | Cambodia | 51 % |
| 48 | Azerbaijan | 51 % |
| 49 | Mauritania | 51 % |
| 50 | Turkmenistan | 50.9 % |
| 51 | Spain its history → | 50.9 % |
| 52 | Eswatini | 50.9 % |
| 53 | Tajikistan | 50.9 % |
| 54 | Bangladesh | 50.8 % |
| 55 | Kosovo | 50.8 % |
| 56 | Nicaragua | 50.8 % |
| 57 | South Sudan | 50.8 % |
| 58 | Brazil | 50.8 % |
| 59 | Austria | 50.8 % |
| 60 | United Kingdom | 50.8 % |
| 61 | Belgium | 50.7 % |
| 62 | Czechia | 50.7 % |
| 63 | New Caledonia | 50.7 % |
| 64 | Colombia | 50.7 % |
| 65 | Cuba | 50.7 % |
| 66 | Eritrea | 50.6 % |
| 67 | Germany its history → | 50.6 % |
| 68 | Costa Rica | 50.6 % |
| 69 | Venezuela | 50.6 % |
| 70 | Albania | 50.6 % |
| 71 | Finland | 50.6 % |
| 72 | Guinea-Bissau | 50.6 % |
| 73 | Kyrgyzstan | 50.6 % |
| 74 | Trinidad & Tobago | 50.6 % |
| 75 | Tunisia | 50.6 % |
| 76 | Jamaica | 50.6 % |
| 77 | North Korea | 50.5 % |
| 78 | Angola | 50.5 % |
| 79 | Guinea | 50.5 % |
| 80 | Haiti | 50.5 % |
| 81 | Ireland | 50.5 % |
| 82 | Taiwan | 50.5 % |
| 83 | Zambia | 50.5 % |
| 84 | Tanzania | 50.4 % |
| 85 | Djibouti | 50.4 % |
| 86 | Sudan | 50.4 % |
| 87 | Guatemala | 50.4 % |
| 88 | Uganda | 50.4 % |
| 89 | Congo - Kinshasa | 50.4 % |
| 90 | Australia its history → | 50.4 % |
| 91 | Argentina its history → | 50.4 % |
| 92 | Fiji | 50.4 % |
| 93 | Palestine | 50.4 % |
| 94 | Canada | 50.3 % |
| 95 | Burundi | 50.3 % |
| 96 | Switzerland its history → | 50.3 % |
| 97 | Netherlands its history → | 50.3 % |
| 98 | New Zealand | 50.3 % |
| 99 | Chile | 50.3 % |
| 100 | Denmark | 50.3 % |
| 101 | Dominican Republic | 50.3 % |
| 102 | Kenya | 50.3 % |
| 103 | Peru | 50.3 % |
| 104 | Myanmar (Burma) | 50.2 % |
| 105 | Israel | 50.2 % |
| 106 | Gambia | 50.2 % |
| 107 | Burkina Faso | 50.2 % |
| 108 | Botswana | 50.2 % |
| 109 | Cameroon | 50.2 % |
| 110 | Ecuador | 50.2 % |
| 111 | Mongolia | 50.1 % |
| 112 | Sierra Leone | 50.1 % |
| 113 | Philippines | 50.1 % |
| 114 | South Korea | 50.1 % |
| 115 | Türkiye | 50.1 % |
| 116 | Liberia | 50.1 % |
| 117 | Ghana | 50.1 % |
| 118 | Suriname | 50.1 % |
| 119 | Congo - Brazzaville | 50 % |
| 120 | Panama | 50 % |
| 121 | Syria | 50 % |
| 122 | Bolivia | 49.9 % |
| 123 | Ethiopia | 49.9 % |
| 124 | Somalia | 49.9 % |
| 125 | Falkland Islands (Islas Malvinas) | 49.9 % |
| 126 | Paraguay | 49.9 % |
| 127 | Benin | 49.9 % |
| 128 | Madagascar | 49.8 % |
| 129 | Chad | 49.8 % |
| 130 | Iraq | 49.8 % |
| 131 | Indonesia | 49.8 % |
| 132 | Slovenia | 49.8 % |
| 133 | United States | 49.8 % |
| 134 | Laos | 49.8 % |
| 135 | Honduras | 49.7 % |
| 136 | Luxembourg | 49.7 % |
| 137 | Togo | 49.7 % |
| 138 | Sweden its history → | 49.6 % |
| 139 | Cyprus | 49.6 % |
| 140 | Norway | 49.6 % |
| 141 | Morocco | 49.6 % |
| 142 | Timor-Leste | 49.6 % |
| 143 | Belize | 49.6 % |
| 144 | Uzbekistan | 49.6 % |
| 145 | Mali | 49.5 % |
| 146 | Afghanistan | 49.5 % |
| 147 | Egypt | 49.5 % |
| 148 | Vanuatu | 49.5 % |
| 149 | Nigeria | 49.4 % |
| 150 | Yemen | 49.3 % |
| 151 | Pakistan | 49.3 % |
| 152 | Gabon | 49.2 % |
| 153 | Niger | 49.2 % |
| 154 | Iran | 49.2 % |
| 155 | Senegal | 49.2 % |
| 156 | Libya | 49.2 % |
| 157 | Côte d’Ivoire | 49.1 % |
| 158 | China | 49.1 % |
| 159 | Algeria | 49 % |
| 160 | Solomon Islands | 48.9 % |
| 161 | Iceland | 48.8 % |
| 162 | Papua New Guinea | 48.6 % |
| 163 | India its history → | 48.4 % |
| 164 | Jordan | 48.4 % |
| 165 | Singapore | 48.3 % |
| 166 | Malta | 48.1 % |
| 167 | Malaysia | 47.6 % |
| 168 | Greenland | 47.5 % |
| 169 | Equatorial Guinea | 47.3 % |
| 170 | Brunei | 46.9 % |
| 171 | Bhutan | 46.6 % |
| 172 | Western Sahara | 44.9 % |
| 173 | Saudi Arabia | 39.5 % |
| 174 | Kuwait | 38.9 % |
| 175 | Oman | 37.8 % |
| 176 | United Arab Emirates | 36.1 % |
| 177 | Qatar | 28.7 % |
1 countries or territories have no value that year.
Continent averages
| World (population-weighted average) | 49.7 % |
| Europe (average) | 51.5 % |
| Africa (average) | 50.1 % |
| Americas (average) | 50.4 % |
| Asia (average) | 49.1 % |
| Oceania (average) | 49.9 % |
Understanding this map
Almost everywhere close to 50%
Slightly more boys than girls are born (about 105 per 100), but women live longer: the two effects roughly cancel out, and most countries have 49 to 52% women. Worldwide, women make up 49.7% of the population: there are slightly more men, because of China and India. France has 51.5% women, about like Japan (51.2%); the United States is at 49.8%.
The gaps and their causes
Three causes push a country away from the average. Male labour migration: in the Gulf states, workers from South Asia bring the share of women down to 29% in Qatar, 36% in the UAE, 39% in Kuwait and Saudi Arabia. Male mortality: in Russia, Ukraine, Belarus or the Baltic states, alcohol, tobacco and accidents kill men early, and women make up about 53.5% of the population. Sex-selective births: in China and India, abortion of girls has skewed births (up to 117 boys per 100 girls in China around 2005), hence 49.1% and 48.4% women.
Wars
Scroll through the years: in 1950, the USSR (Russia 56.5%, Ukraine 57%) and Germany (54.5%) still bear the mark of the men killed in the Second World War. The gap closes as those generations die out.
Source and method
UN estimates (World Population Prospects), via Gapminder. Gapminder publishes the share of each sex aged under 15 and 65 or over; the share of women follows exactly from them (within a few hundredths of a point of UN figures). World and continents: population-weighted average. The tooltip also gives the number of men per 100 women.
Sources : ONU, World Population Prospects, via Gapminder (CC BY 4.0)
In the same theme : Population
All maps
Page updated on 2026-11-15.