Years of salary to buy 70 m²
Price of a 70 m² home divided by the average gross annual salary, in 2024: how many years of full salary it would take. European countries only.
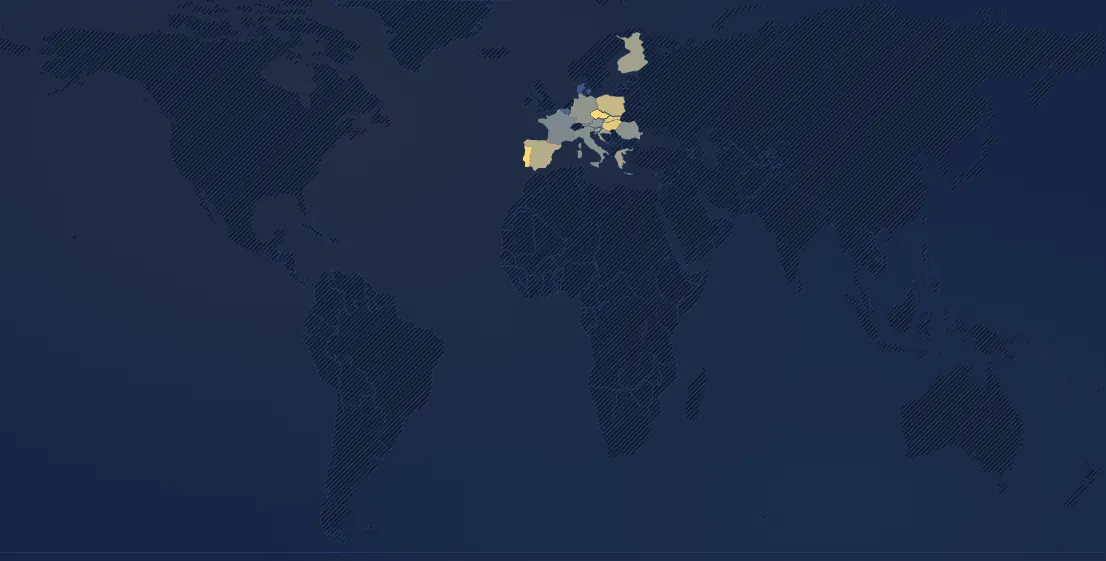
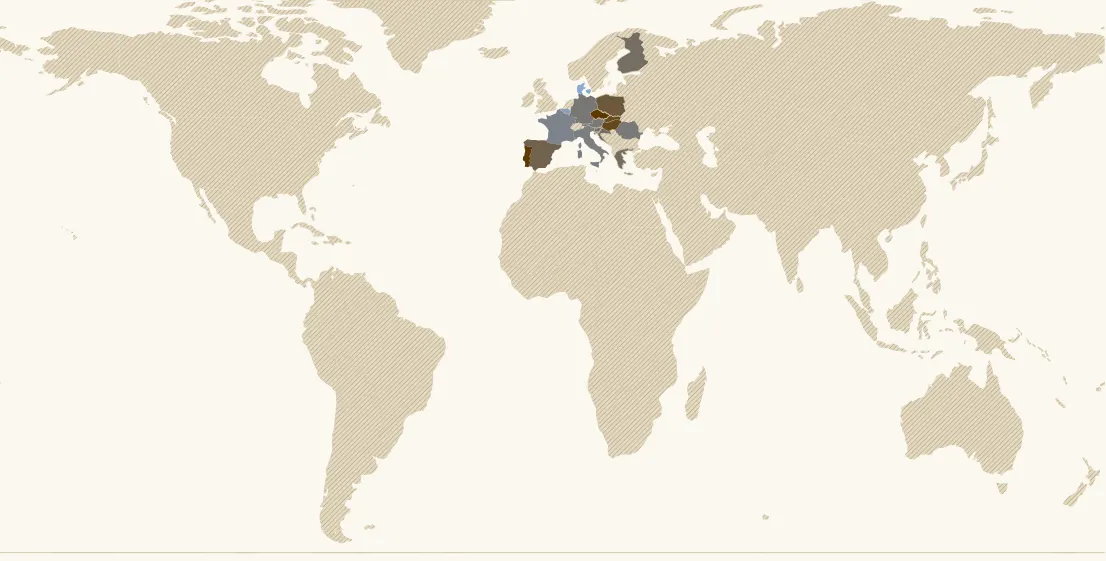
In 2024, 18 countries have a value. Highest: Czechia (14.8 years), Portugal (14.1 years), Hungary (11.6 years). Lowest: Denmark (3.2 years), Belgium (3.8 years), France (5.3 years). France: 5.3 years (16th of 18).
Country ranking in 2024
| Rank | Country | Value |
|---|---|---|
| 1 | Czechia | 14.8 years |
| 2 | Portugal its history → | 14.1 years |
| 3 | Hungary its history → | 11.6 years |
| 4 | Slovakia | 11.2 years |
| 5 | Poland | 9 years |
| 6 | Spain its history → | 7.8 years |
| 7 | Luxembourg | 7.5 years |
| 8 | Croatia | 7.1 years |
| 9 | Greece | 7 years |
| 10 | Finland | 6.9 years |
| 11 | Slovenia | 6.8 years |
| 12 | Germany its history → | 6.2 years |
| 13 | Austria | 6 years |
| 14 | Romania | 6 years |
| 15 | Italy | 5.7 years |
| 16 | France its history → | 5.3 years |
| 17 | Belgium | 3.8 years |
| 18 | Denmark | 3.2 years |
160 countries or territories have no value that year.
Understanding this map
How it is computed
Average price per m² of new homes in 2024 published by Deloitte (Property Index 2025), multiplied by 70 m², then divided by the average gross annual salary of a full-time employee in 2024 (Eurostat). It is the method Deloitte applies to big cities, brought down to country level: it is the only direct comparison between countries that open data allow. It ignores the down payment, loan interest and the fact that nobody spends their whole salary on housing.
With a mortgage: the payment burden
The “monthly payment / salary” button adds the interest rate: it is what one actually pays each month. In 2024, with a 25-year loan and no down payment at the country's average rate, 70 m² at the average price costs about 32% of the average gross salary in France (3.4%), 39% in Germany, 46% in Spain, 72% in Slovakia and 89% in Portugal, against 23% in Belgium. A lower or higher rate changes the result a lot: at 2% instead of 4%, the payment falls by a quarter. Using the median rather than the average salary, all these figures would be higher (for France, about 42% instead of 32%). Only euro-area countries have an average rate published by the ECB.
What it shows
Central Europe is where housing costs the most in years of salary: about 15 years in Czechia and Portugal, 11 to 12 in Hungary and Slovakia, 9 in Poland. New-build prices there have caught up with Western Europe while salaries remain two to three times lower. At the other end, Denmark (3.2 years) and Belgium (3.8) combine high salaries with moderate average prices; France is at 5.3 years, Germany 6.2, Spain 7.8. Gaps between cities are wider still: according to Deloitte, from 4.9 years in Odense or Turin to 15.4 in Amsterdam.
Limits
A single year and eighteen countries: those of the European Union found in both Deloitte and Eurostat (the Netherlands lack salary data, Sweden price data). Deloitte prices are generally asking prices for new homes; for France they are existing homes, for Romania all homes. National averages: a country with moderate prices can have an unaffordable capital. Average gross salary, pulled up by high earners, and not the income of a two-earner household. For trends over time and other continents, see “House prices”.
In the same theme : Wealth
All maps
Page updated on 2026-11-15.