Emigrants: share of natives living abroad
Among people born in the country, the share now living in another country. These are stocks (everyone who left and still lives abroad), not departures in a given year.
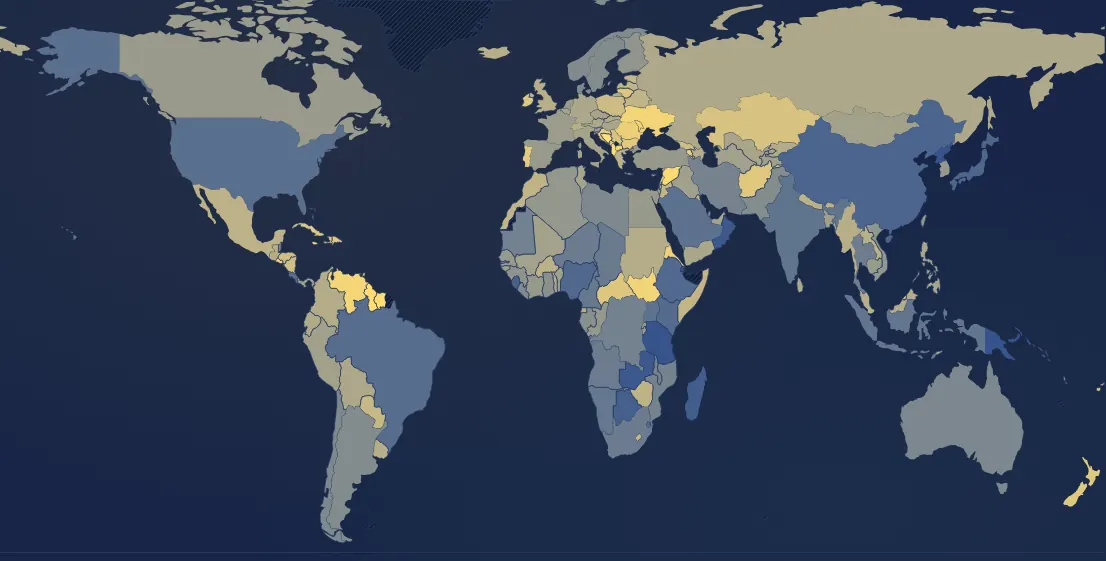
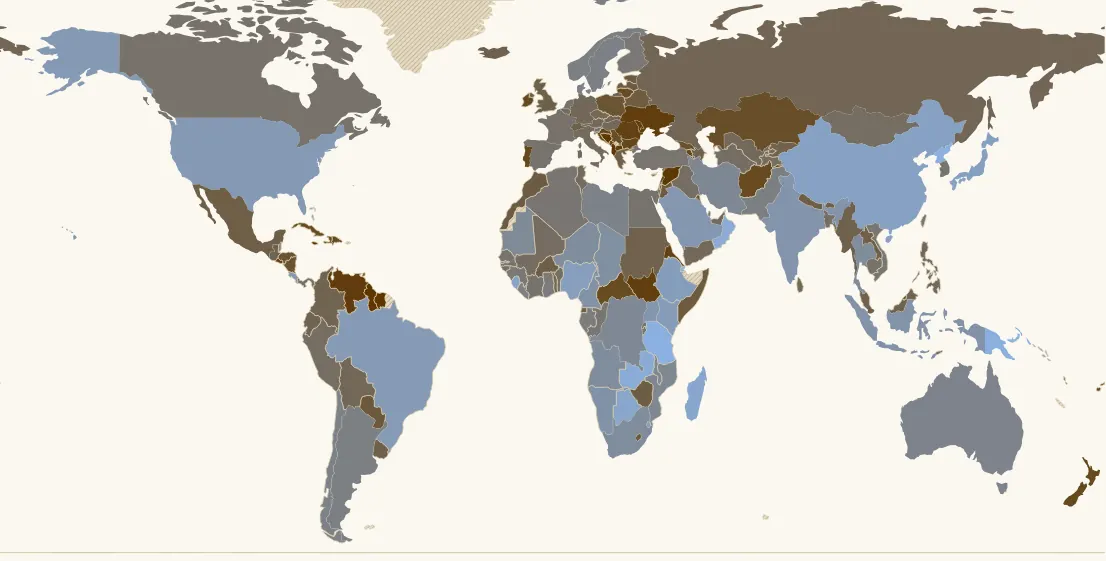
In 2024, 169 countries have a value. Highest: Palestine (45 %), Guyana (38 %), Bosnia & Herzegovina (34 %). Lowest: North Korea (0.2 %), Papua New Guinea (0.3 %), Tanzania (0.3 %). World (population-weighted average): 3.4 %. France: 4.3 % (102nd of 169).
Country ranking in 2024
| Rank | Country | Value |
|---|---|---|
| 1 | Palestine | 45 % |
| 2 | Guyana | 38 % |
| 3 | Bosnia & Herzegovina | 34 % |
| 4 | Jamaica | 31 % |
| 5 | Albania | 31 % |
| 6 | Suriname | 31 % |
| 7 | Syria | 27 % |
| 8 | North Macedonia | 24 % |
| 9 | Venezuela | 23 % |
| 10 | Moldova | 23 % |
| 11 | Ukraine its history → | 23 % |
| 12 | El Salvador | 23 % |
| 13 | South Sudan | 22 % |
| 14 | Eritrea | 21 % |
| 15 | Romania | 20 % |
| 16 | Croatia | 20 % |
| 17 | Armenia | 19 % |
| 18 | Trinidad & Tobago | 19 % |
| 19 | Fiji | 17 % |
| 20 | Bulgaria | 16 % |
| 21 | Portugal its history → | 16 % |
| 22 | Luxembourg | 16 % |
| 23 | New Zealand | 15 % |
| 24 | Dominican Republic | 15 % |
| 25 | Afghanistan | 15 % |
| 26 | Ireland | 15 % |
| 27 | Central African Republic | 15 % |
| 28 | Haiti | 15 % |
| 29 | Cuba | 15 % |
| 30 | Lithuania | 15 % |
| 31 | Montenegro | 14 % |
| 32 | Serbia | 14 % |
| 33 | Lebanon | 13 % |
| 34 | Kazakhstan | 13 % |
| 35 | Brunei | 12 % |
| 36 | Georgia | 12 % |
| 37 | Nicaragua | 12 % |
| 38 | Honduras | 11 % |
| 39 | Malta | 11 % |
| 40 | Poland | 11 % |
| 41 | Paraguay | 10 % |
| 42 | Estonia | 9.7 % |
| 43 | Lesotho | 9.6 % |
| 44 | Jordan | 9.5 % |
| 45 | Kuwait | 9.4 % |
| 46 | Somalia | 9.3 % |
| 47 | Belarus | 9 % |
| 48 | Latvia | 8.9 % |
| 49 | Morocco | 8.7 % |
| 50 | Zimbabwe | 8.6 % |
| 51 | Greece | 8.3 % |
| 52 | Nepal | 8.3 % |
| 53 | Singapore | 8.3 % |
| 54 | Burkina Faso | 8.3 % |
| 55 | Bhutan | 8.3 % |
| 56 | Mexico | 8.2 % |
| 57 | Laos | 7.9 % |
| 58 | United Kingdom | 7.7 % |
| 59 | Switzerland its history → | 7.7 % |
| 60 | Equatorial Guinea | 7.7 % |
| 61 | Uruguay | 7.5 % |
| 62 | Azerbaijan | 7.4 % |
| 63 | Guatemala | 7.4 % |
| 64 | Myanmar (Burma) | 7.4 % |
| 65 | Iceland | 7.3 % |
| 66 | Sudan | 7.3 % |
| 67 | Timor-Leste | 7.3 % |
| 68 | Kyrgyzstan | 7.2 % |
| 69 | Malaysia | 7.1 % |
| 70 | Slovakia | 7 % |
| 71 | Colombia | 6.8 % |
| 72 | Ecuador | 6.7 % |
| 73 | Cyprus | 6.5 % |
| 74 | Russia | 6.2 % |
| 75 | Sri Lanka | 6.1 % |
| 76 | Bolivia | 6 % |
| 77 | Togo | 6 % |
| 78 | Austria | 6 % |
| 79 | Germany its history → | 6 % |
| 80 | Yemen | 5.8 % |
| 81 | Philippines | 5.7 % |
| 82 | Uzbekistan | 5.7 % |
| 83 | Czechia | 5.7 % |
| 84 | Hungary its history → | 5.7 % |
| 85 | Tunisia | 5.5 % |
| 86 | United Arab Emirates | 5.5 % |
| 87 | Italy | 5.3 % |
| 88 | Belgium | 5.3 % |
| 89 | Mali | 5.1 % |
| 90 | Benin | 4.9 % |
| 91 | Peru | 4.9 % |
| 92 | Bangladesh | 4.9 % |
| 93 | Mongolia | 4.8 % |
| 94 | Iraq | 4.8 % |
| 95 | Turkmenistan | 4.8 % |
| 96 | Tajikistan | 4.8 % |
| 97 | Panama | 4.6 % |
| 98 | Guinea-Bissau | 4.5 % |
| 99 | Vanuatu | 4.5 % |
| 100 | Israel | 4.3 % |
| 101 | Cambodia | 4.3 % |
| 102 | France its history → | 4.3 % |
| 103 | Slovenia | 4.2 % |
| 104 | Canada | 4.2 % |
| 105 | Burundi | 4.1 % |
| 106 | Egypt | 4 % |
| 107 | Côte d’Ivoire | 4 % |
| 108 | Spain its history → | 4 % |
| 109 | Netherlands its history → | 4 % |
| 110 | Senegal | 3.9 % |
| 111 | South Korea | 3.9 % |
| 112 | Rwanda | 3.8 % |
| 113 | Türkiye | 3.8 % |
| 114 | Congo - Brazzaville | 3.7 % |
| 115 | Algeria | 3.7 % |
| 116 | Taiwan | 3.6 % |
| 117 | Vietnam | 3.5 % |
| 118 | Finland | 3.4 % |
| 119 | Guinea | 3.4 % |
| 120 | Ghana | 3 % |
| 121 | Gabon | 2.8 % |
| 122 | Gambia | 2.8 % |
| 123 | Pakistan | 2.7 % |
| 124 | Qatar | 2.7 % |
| 125 | Argentina its history → | 2.6 % |
| 126 | Sweden its history → | 2.6 % |
| 127 | Norway | 2.6 % |
| 128 | Liberia | 2.6 % |
| 129 | Chile | 2.4 % |
| 130 | Denmark | 2.4 % |
| 131 | Libya | 2.4 % |
| 132 | Australia its history → | 2.3 % |
| 133 | Belize | 2.1 % |
| 134 | Mozambique | 2 % |
| 135 | Malawi | 2 % |
| 136 | Iran | 1.9 % |
| 137 | Congo - Kinshasa | 1.9 % |
| 138 | Mauritania | 1.8 % |
| 139 | Thailand | 1.7 % |
| 140 | Angola | 1.6 % |
| 141 | Niger | 1.6 % |
| 142 | South Africa | 1.6 % |
| 143 | Chad | 1.5 % |
| 144 | Cameroon | 1.4 % |
| 145 | Namibia | 1.4 % |
| 146 | Indonesia | 1.3 % |
| 147 | India its history → | 1.3 % |
| 148 | Uganda | 1.2 % |
| 149 | Saudi Arabia | 1.2 % |
| 150 | Costa Rica | 1.1 % |
| 151 | United States | 1.1 % |
| 152 | Brazil | 1 % |
| 153 | Solomon Islands | 1 % |
| 154 | Kenya | 1 % |
| 155 | Eswatini | 1 % |
| 156 | Ethiopia | 0.9 % |
| 157 | Nigeria | 0.9 % |
| 158 | Japan | 0.8 % |
| 159 | China | 0.8 % |
| 160 | Sierra Leone | 0.7 % |
| 161 | Botswana | 0.7 % |
| 162 | Madagascar | 0.7 % |
| 163 | Bahamas | 0.7 % |
| 164 | Zambia | 0.6 % |
| 165 | Oman | 0.6 % |
| 166 | Djibouti | 0.3 % |
| 167 | Tanzania | 0.3 % |
| 168 | Papua New Guinea | 0.3 % |
| 169 | North Korea | 0.2 % |
9 countries or territories have no value that year.
Continent averages
| World (population-weighted average) | 3.4 % |
| Europe (average) | 8.1 % |
| Africa (average) | 2.9 % |
| Americas (average) | 5 % |
| Asia (average) | 2.4 % |
| Oceania (average) | 3.7 % |
Understanding this map
Who leaves?
In 2024 the UN counts 304 million international migrants, about 3.7% of the world population (the World line, slightly lower, counts only those whose country of birth is known). The countries losing the most people are small, poor or at war: Guyana (38% of its natives live abroad), Bosnia (34%), Albania, Jamaica and Suriname (31%), Syria (27%), Ukraine (23%), Romania (20%), Portugal (16%). Mexico has 8% (11.6 million, almost all in the United States), the Philippines 5.7% (7 million), France 4.2% (2.5 million, mainly in the United States, Spain and Belgium). Large countries have low rates even with many emigrants: India has 18.5 million, the largest number in the world, but 1.3% of its natives.
Men or women?
Worldwide, 48% of emigrants are women, but gaps are large (“share of women” view). Emigration to Gulf building sites is very male: Bangladesh 27% women, Pakistan and Egypt 30%, India 36%. Conversely, the Philippines (57%), Thailand (63%) or China (56%) send many women: domestic workers, nurses, marriages abroad. Russia, Ukraine and Belarus are also around 59%, partly because their emigrants are older and women live longer. France is balanced (50%).
Limits
Source: UN, International Migrant Stock 2024, based on censuses of destination countries, one figure every five years from 1990 to 2020 then 2024, intermediate years interpolated. An emigrant is a person born in the country and counted in another, whatever their nationality; refugees are included (Syria, Palestine, where refugees registered with UNRWA are counted). After the end of the USSR or Yugoslavia, people who became “foreign” without moving are counted as emigrants (many Russians born in Ukraine, and the reverse). Undeclared departures and irregular migrants are poorly covered. The share is computed on natives: emigrants ÷ (residents − immigrants + emigrants). Share of women: countries with at least 10,000 emigrants.
Sources : ONU DESA, International Migrant Stock 2024 (CC BY 3.0 IGO)
In the same theme : Population
All maps
Page updated on 2026-11-15.