Immigrant employment: gap with natives
Employment rate of people aged 15-64 born abroad minus that of people aged 15-64 born in the country, in points. Negative: immigrants work less often than natives; positive: more often.
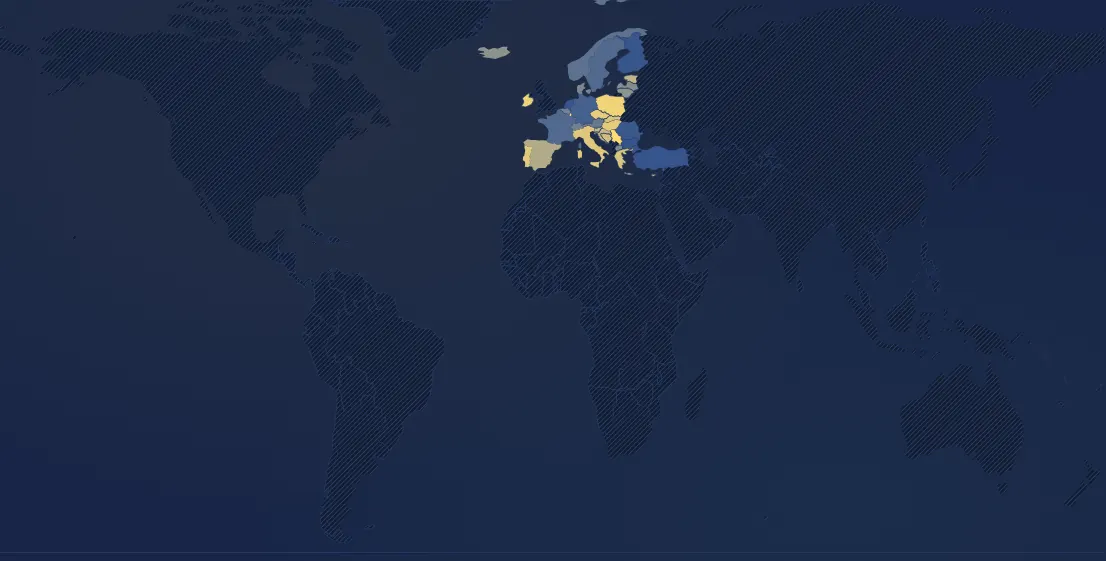
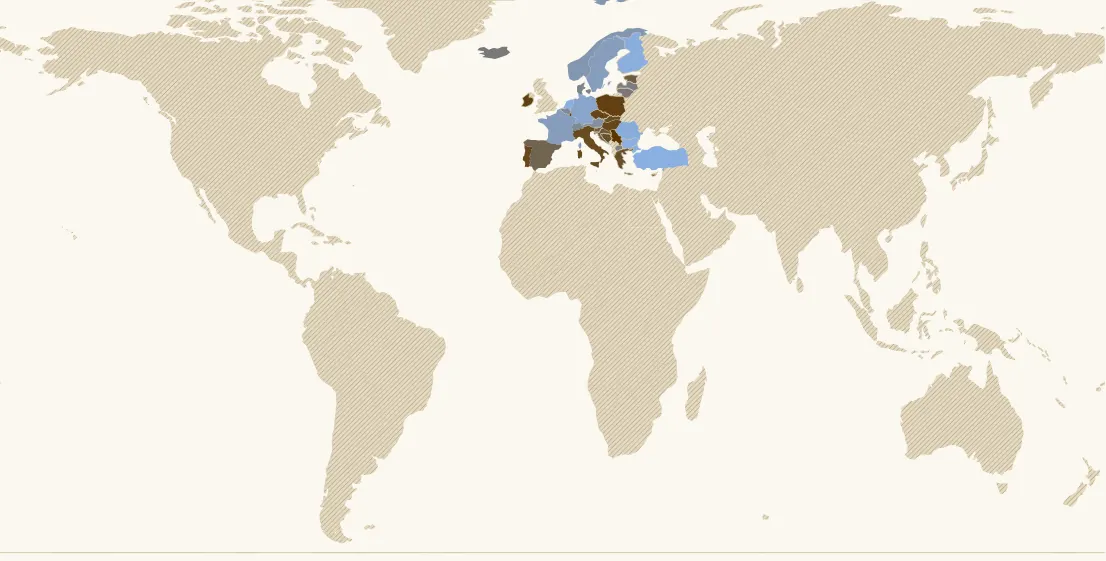
In 2025, 33 countries have a value. Highest: Luxembourg (+10.6 pts), Serbia (+5.9 pts), Poland (+4.6 pts). Lowest: Bulgaria (−15.4 pts), Netherlands (−13 pts), Türkiye (−12.3 pts). France: −8.5 pts (27th of 33).
Country ranking in 2025
| Rank | Country | Value |
|---|---|---|
| 1 | Luxembourg | +10.6 pts |
| 2 | Serbia | +5.9 pts |
| 3 | Poland | +4.6 pts |
| 4 | Ireland | +4.5 pts |
| 5 | Czechia | +3.8 pts |
| 6 | Hungary its history → | +3.6 pts |
| 7 | Portugal its history → | +3.4 pts |
| 8 | Italy | +3 pts |
| 9 | Slovakia | +2.5 pts |
| 10 | Greece | +2.5 pts |
| 11 | Bosnia & Herzegovina | +2.1 pts |
| 12 | Croatia | +1.1 pts |
| 13 | Slovenia | +0.5 pts |
| 14 | Estonia | +0.4 pts |
| 15 | Cyprus | +0.1 pts |
| 16 | Spain its history → | −0.5 pts |
| 17 | Lithuania | −2.8 pts |
| 18 | Iceland | −2.9 pts |
| 19 | Latvia | −3.7 pts |
| 20 | North Macedonia | −3.9 pts |
| 21 | Denmark | −4.4 pts |
| 22 | Belgium | −5.3 pts |
| 23 | Switzerland its history → | −5.5 pts |
| 24 | Austria | −6.3 pts |
| 25 | Norway | −7.4 pts |
| 26 | Sweden its history → | −8.4 pts |
| 27 | France its history → | −8.5 pts |
| 28 | Germany its history → | −10 pts |
| 29 | Romania | −11.5 pts |
| 30 | Finland | −11.8 pts |
| 31 | Türkiye | −12.3 pts |
| 32 | Netherlands its history → | −13 pts |
| 33 | Bulgaria | −15.4 pts |
145 countries or territories have no value that year.
Continent averages
| Europe (average) | −5.1 pts |
Understanding this map
What matters for public finances
What an immigrant brings to or costs public finances depends above all on employment: a worker pays taxes and contributions, a non-worker receives benefits. According to the OECD (2021), immigrants' net contribution is small everywhere, within about 1% of GDP, and would be clearly better where they work as much as natives. In 2025, in France, 62% of immigrants aged 15-64 have a job against 70.5% of natives (−8.5 points); the gap reaches −14 points among women (54.5% against 69%).
Two Europes
In 2025, in north-western Europe (Netherlands −13 points, Finland −12, Germany −10, France and Sweden −8.5, Belgium −5), immigrants work clearly less than natives: many arrived through family reunification or asylum, and women born outside the EU often have no job. In the south and east (Italy +3, Portugal +3, Czechia +4, Poland +5), they work more than natives: immigration there is recent and mostly for work, and natives' employment rate is lower. People born in another EU country have almost everywhere a rate close to natives'; the gap comes mainly from people born outside the EU.
Limits
European Union Labour Force Surveys (Eurostat, lfsa_ergacob), 2016-2025, European countries only; United Kingdom until it left the EU. An “immigrant” is anyone born abroad, including citizens born abroad. Age, education and length of stay differ between immigrants and natives: at equal education, part of the gap disappears. Compare with the “Reasons for immigration” map.
Sources : Eurostat, enquête sur les forces de travail (lfsa_ergacob)
In the same theme : Population
All maps
Page updated on 2026-11-15.