Net migration
Arrivals minus departures in a year, as a share of the population. Positive: more people settle in the country than leave it; negative: the country loses people through emigration.
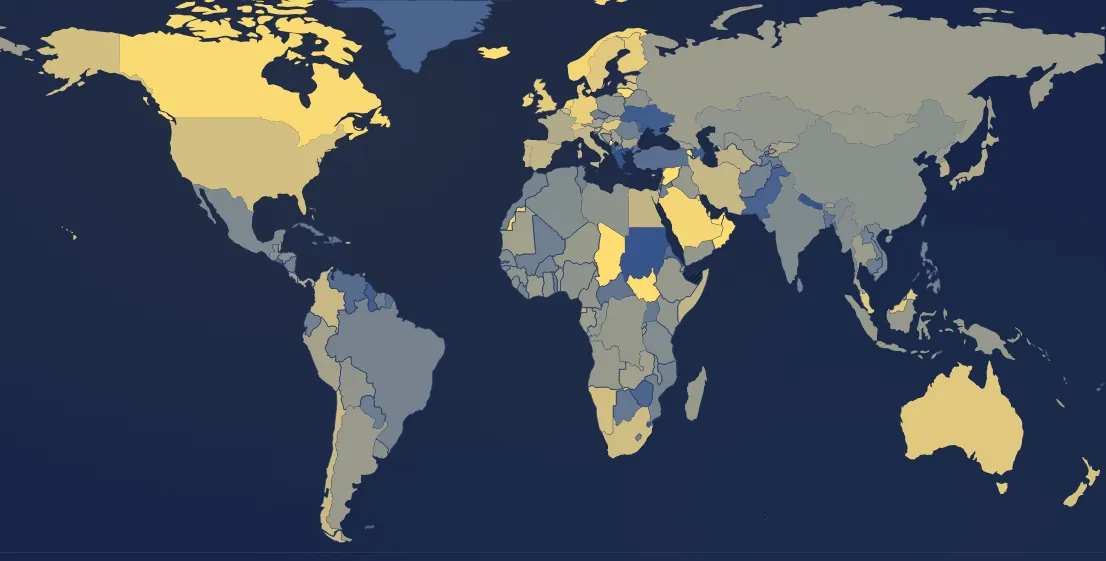
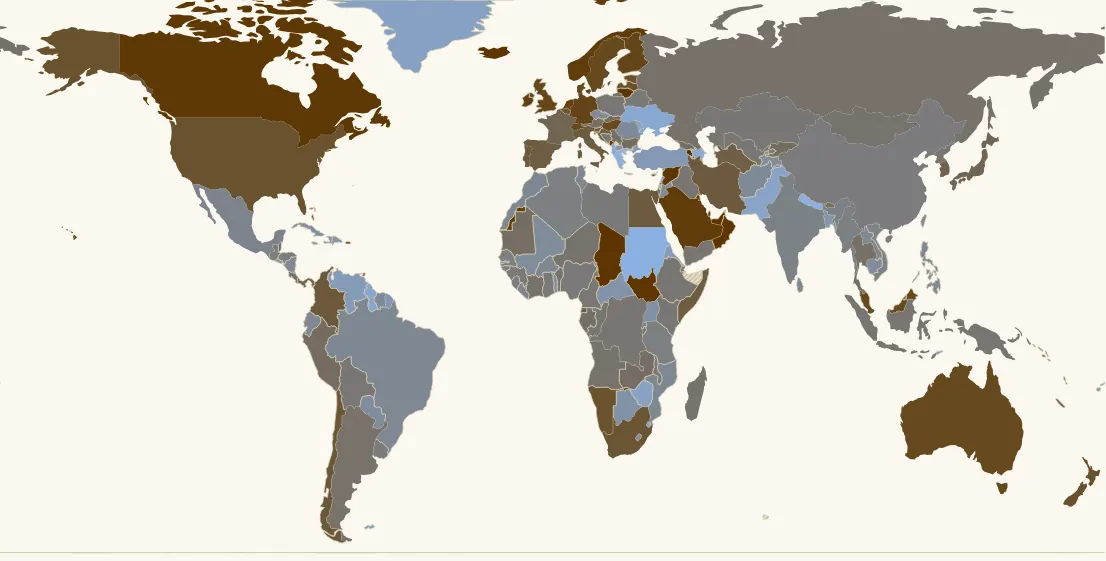
In 2023, 176 countries have a value. Highest: South Sudan (+4 %), Syria (+3.2 %), Oman (+3.1 %). Lowest: Sudan (−2.7 %), Greece (−1.6 %), Nepal (−1.4 %). France: +0.14 % (57th of 176).
Country ranking in 2023
| Rank | Country | Value |
|---|---|---|
| 1 | South Sudan | +4 % |
| 2 | Syria | +3.2 % |
| 3 | Oman | +3.1 % |
| 4 | United Arab Emirates | +2.8 % |
| 5 | Chad | +2.6 % |
| 6 | Armenia | +2.6 % |
| 7 | Montenegro | +1.9 % |
| 8 | Lithuania | +1.6 % |
| 9 | Qatar | +1.3 % |
| 10 | Malta | +1.2 % |
| 11 | Iceland | +1.2 % |
| 12 | Canada | +1.1 % |
| 13 | Kuwait | +1 % |
| 14 | Saudi Arabia | +0.98 % |
| 15 | Western Sahara | +0.97 % |
| 16 | Norway | +0.97 % |
| 17 | Luxembourg | +0.89 % |
| 18 | Ireland | +0.84 % |
| 19 | Netherlands its history → | +0.8 % |
| 20 | Germany its history → | +0.72 % |
| 21 | Finland | +0.68 % |
| 22 | Cyprus | +0.65 % |
| 23 | United Kingdom | +0.65 % |
| 24 | Puerto Rico | +0.61 % |
| 25 | Australia its history → | +0.53 % |
| 26 | Denmark | +0.52 % |
| 27 | Malaysia | +0.52 % |
| 28 | Sweden its history → | +0.52 % |
| 29 | Switzerland its history → | +0.51 % |
| 30 | Hungary its history → | +0.51 % |
| 31 | Singapore | +0.47 % |
| 32 | Estonia | +0.42 % |
| 33 | Latvia | +0.42 % |
| 34 | New Zealand | +0.41 % |
| 35 | Namibia | +0.39 % |
| 36 | United States | +0.39 % |
| 37 | Belgium | +0.36 % |
| 38 | South Africa | +0.36 % |
| 39 | Chile | +0.32 % |
| 40 | Colombia | +0.3 % |
| 41 | Iran | +0.29 % |
| 42 | Portugal its history → | +0.28 % |
| 43 | Egypt | +0.27 % |
| 44 | Croatia | +0.26 % |
| 45 | Bahamas | +0.25 % |
| 46 | Spain its history → | +0.25 % |
| 47 | Italy | +0.25 % |
| 48 | Somalia | +0.25 % |
| 49 | Slovenia | +0.25 % |
| 50 | Equatorial Guinea | +0.22 % |
| 51 | Solomon Islands | +0.2 % |
| 52 | Turkmenistan | +0.2 % |
| 53 | South Korea | +0.17 % |
| 54 | New Caledonia | +0.17 % |
| 55 | Panama | +0.16 % |
| 56 | Belize | +0.14 % |
| 57 | France its history → | +0.14 % |
| 58 | Japan | +0.14 % |
| 59 | Trinidad & Tobago | +0.14 % |
| 60 | Israel | +0.11 % |
| 61 | Slovakia | +0.09 % |
| 62 | Bulgaria | +0.08 % |
| 63 | Kyrgyzstan | +0.08 % |
| 64 | Peru | +0.07 % |
| 65 | Mauritania | +0.06 % |
| 66 | Serbia | +0.06 % |
| 67 | Austria | +0.05 % |
| 68 | Georgia | +0.05 % |
| 69 | Zambia | +0.05 % |
| 70 | Bhutan | +0.04 % |
| 71 | Djibouti | +0.04 % |
| 72 | Gabon | +0.04 % |
| 73 | Thailand | +0.03 % |
| 74 | Côte d’Ivoire | +0.02 % |
| 75 | Costa Rica | +0.02 % |
| 76 | Russia | +0.02 % |
| 77 | Argentina its history → | +0.01 % |
| 78 | Burundi | +0.01 % |
| 79 | Angola | 0 % |
| 80 | Benin | 0 % |
| 81 | Bermuda | 0 % |
| 82 | Brunei | 0 % |
| 83 | Madagascar | 0 % |
| 84 | Mongolia | 0 % |
| 85 | Niger | 0 % |
| 86 | Vanuatu | 0 % |
| 87 | Congo - Kinshasa | −0.01 % |
| 88 | Ethiopia | −0.01 % |
| 89 | Indonesia | −0.01 % |
| 90 | Iraq | −0.01 % |
| 91 | Papua New Guinea | −0.01 % |
| 92 | North Korea | −0.01 % |
| 93 | Yemen | −0.01 % |
| 94 | Bosnia & Herzegovina | −0.02 % |
| 95 | Bolivia | −0.02 % |
| 96 | Cameroon | −0.02 % |
| 97 | Congo - Brazzaville | −0.02 % |
| 98 | Kazakhstan | −0.02 % |
| 99 | Kenya | −0.02 % |
| 100 | Poland | −0.02 % |
| 101 | Uzbekistan | −0.02 % |
| 102 | Belarus | −0.03 % |
| 103 | Ghana | −0.03 % |
| 104 | Guinea | −0.03 % |
| 105 | Libya | −0.03 % |
| 106 | Malawi | −0.03 % |
| 107 | Nigeria | −0.03 % |
| 108 | China | −0.04 % |
| 109 | Uruguay | −0.04 % |
| 110 | Guatemala | −0.05 % |
| 111 | Honduras | −0.05 % |
| 112 | Sierra Leone | −0.05 % |
| 113 | Algeria | −0.06 % |
| 114 | Myanmar (Burma) | −0.06 % |
| 115 | Rwanda | −0.06 % |
| 116 | Senegal | −0.06 % |
| 117 | Tanzania | −0.06 % |
| 118 | Guinea-Bissau | −0.07 % |
| 119 | India its history → | −0.07 % |
| 120 | Mexico | −0.08 % |
| 121 | Vietnam | −0.08 % |
| 122 | Liberia | −0.09 % |
| 123 | Burkina Faso | −0.11 % |
| 124 | Brazil | −0.11 % |
| 125 | Gambia | −0.11 % |
| 126 | Morocco | −0.11 % |
| 127 | Mozambique | −0.11 % |
| 128 | Tunisia | −0.11 % |
| 129 | Afghanistan | −0.12 % |
| 130 | Ecuador | −0.12 % |
| 131 | Sri Lanka | −0.12 % |
| 132 | Nicaragua | −0.12 % |
| 133 | Laos | −0.13 % |
| 134 | Czechia | −0.14 % |
| 135 | Philippines | −0.14 % |
| 136 | Taiwan | −0.14 % |
| 137 | Jordan | −0.15 % |
| 138 | Romania | −0.15 % |
| 139 | Suriname | −0.16 % |
| 140 | Mali | −0.17 % |
| 141 | Cambodia | −0.18 % |
| 142 | Paraguay | −0.18 % |
| 143 | Togo | −0.19 % |
| 144 | Tajikistan | −0.19 % |
| 145 | Cuba | −0.21 % |
| 146 | Lesotho | −0.22 % |
| 147 | Botswana | −0.26 % |
| 148 | Uganda | −0.26 % |
| 149 | Haiti | −0.27 % |
| 150 | Central African Republic | −0.28 % |
| 151 | Dominican Republic | −0.31 % |
| 152 | North Macedonia | −0.31 % |
| 153 | Bangladesh | −0.32 % |
| 154 | Jamaica | −0.35 % |
| 155 | Fiji | −0.36 % |
| 156 | French Guiana | −0.36 % |
| 157 | Türkiye | −0.36 % |
| 158 | El Salvador | −0.37 % |
| 159 | Venezuela | −0.4 % |
| 160 | Timor-Leste | −0.41 % |
| 161 | Eritrea | −0.44 % |
| 162 | Palestine | −0.46 % |
| 163 | Greenland | −0.57 % |
| 164 | Lebanon | −0.59 % |
| 165 | Falkland Islands (Islas Malvinas) | −0.6 % |
| 166 | Zimbabwe | −0.6 % |
| 167 | Moldova | −0.61 % |
| 168 | Pakistan | −0.65 % |
| 169 | Eswatini | −0.69 % |
| 170 | Guyana | −0.75 % |
| 171 | Ukraine its history → | −0.8 % |
| 172 | Azerbaijan | −0.82 % |
| 173 | Albania | −0.9 % |
| 174 | Nepal | −1.4 % |
| 175 | Greece | −1.6 % |
| 176 | Sudan | −2.7 % |
2 countries or territories have no value that year.
Continent averages
| Europe (average) | +0.14 % |
| Africa (average) | −0.03 % |
| Americas (average) | +0.13 % |
| Asia (average) | −0.05 % |
| Oceania (average) | +0.36 % |
Understanding this map
What the balance measures
Net migration counts everyone who settles in the country, minus everyone who leaves it, nationals included: a French person moving to Canada counts as a loss for France. It is a UN estimate, often computed as the change in population minus births and deaths. It does not distinguish legal from illegal immigration: no comparable data exist for the latter.
Orders of magnitude
For France the balance is modest: +0.14% of the population in 2023 (about 90,000 people), +4.4% cumulated from 2000 to 2023. That is less than Germany (+8.6%, with a peak of +1.4% in 2015), the United States (+10.9%) or Spain (+14.8%). Canada has taken in more than 1% of its population a year since 2022. Shocks stand out: Ukraine loses nearly 14% of its population in 2022, Syria over 4% in 2015, Poland gains 2.5% in 2022 as Ukrainians arrive. The Gulf states rely massively on foreign workers.
Limits
Departures are poorly measured almost everywhere, and the latest years are often estimates revised later. Annual values sometimes jump (wars, returns): look at the trend over several years instead. No World line (arrivals and departures cancel out); continents are population-weighted averages.
Sources : ONU, World Population Prospects 2024, via Our World in Data
In the same theme : Population
All maps
Page updated on 2026-11-15.