Trade openness (exports + imports, % of GDP)
Exports and imports of goods and services added together, as a share of GDP: how much a country's economy trades with the rest of the world.
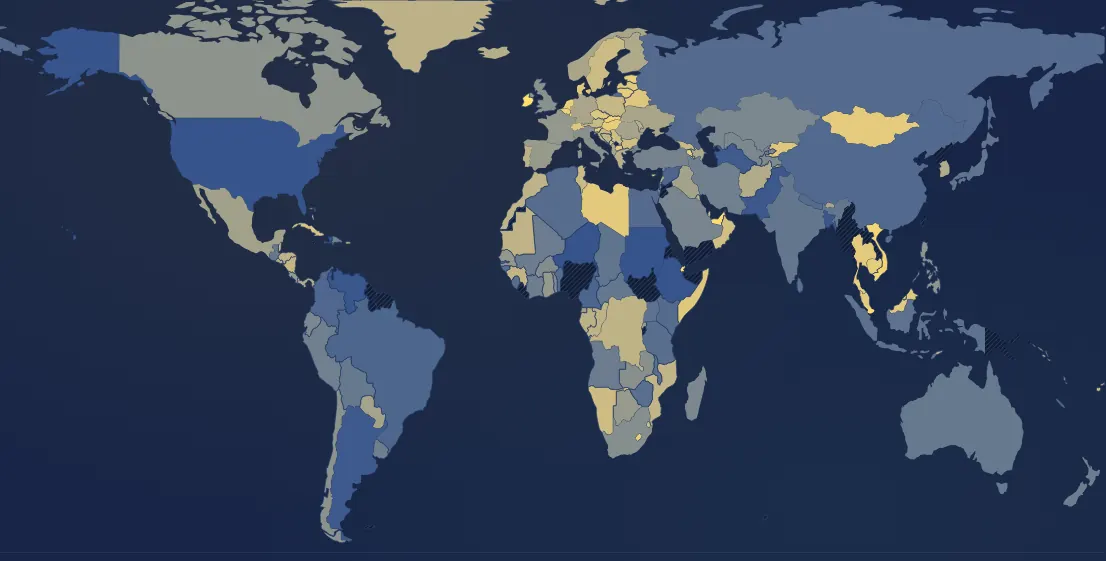
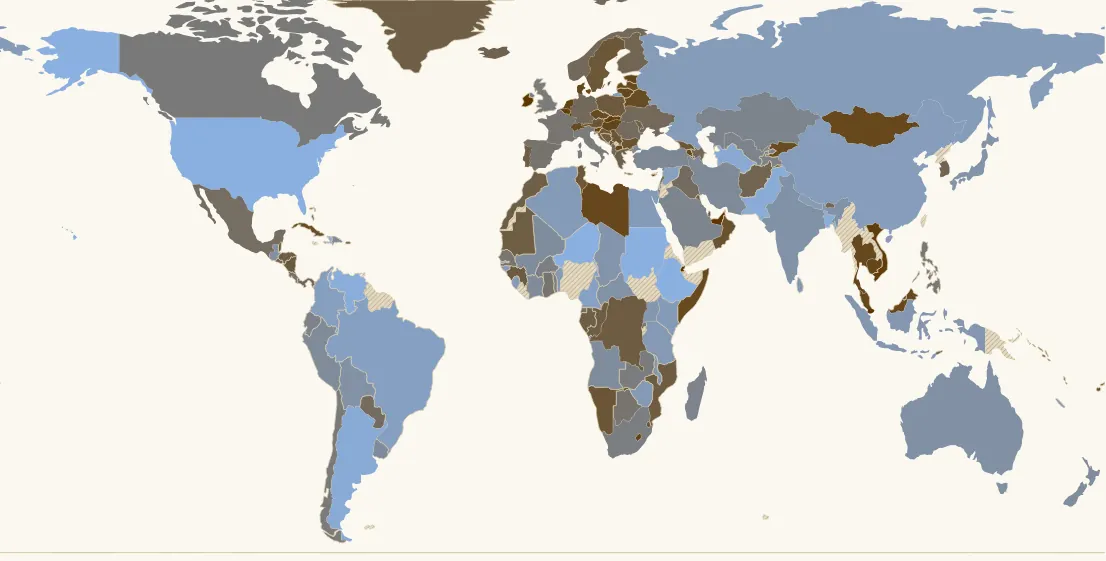
In 2024, 157 countries have a value. Highest: Luxembourg (351 %), Singapore (313 %), Ireland (246 %). Lowest: Sudan (2 %), Ethiopia (17 %), Haiti (19 %). World (GDP-weighted average): 56 %. France: 68 % (94th of 157).
Country ranking in 2024
| Rank | Country | Value |
|---|---|---|
| 1 | Luxembourg | 351 % |
| 2 | Singapore | 313 % |
| 3 | Ireland | 246 % |
| 4 | Djibouti | 241 % |
| 5 | Malta | 218 % |
| 6 | United Arab Emirates | 199 % |
| 7 | Cyprus | 190 % |
| 8 | Vietnam | 174 % |
| 9 | Slovakia | 171 % |
| 10 | Belgium | 159 % |
| 11 | Slovenia | 156 % |
| 12 | Netherlands its history → | 154 % |
| 13 | Lesotho | 153 % |
| 14 | Estonia | 151 % |
| 15 | Armenia | 150 % |
| 16 | Hungary its history → | 148 % |
| 17 | Cambodia | 143 % |
| 18 | Lithuania | 142 % |
| 19 | Mongolia | 138 % |
| 20 | Libya | 138 % |
| 21 | Malaysia | 137 % |
| 22 | North Macedonia | 136 % |
| 23 | Thailand | 136 % |
| 24 | Brunei | 133 % |
| 25 | Denmark | 132 % |
| 26 | Czechia | 132 % |
| 27 | Latvia | 131 % |
| 28 | Switzerland its history → | 130 % |
| 29 | Somalia | 130 % |
| 30 | Kyrgyzstan | 130 % |
| 31 | Belarus | 128 % |
| 32 | Cuba | 125 % |
| 33 | Fiji | 119 % |
| 34 | Oman | 115 % |
| 35 | Serbia | 112 % |
| 36 | Solomon Islands | 111 % |
| 37 | Bulgaria | 110 % |
| 38 | Montenegro | 110 % |
| 39 | Belize | 109 % |
| 40 | Austria | 109 % |
| 41 | Namibia | 108 % |
| 42 | Eswatini | 108 % |
| 43 | Tunisia | 106 % |
| 44 | Sweden its history → | 106 % |
| 45 | Croatia | 105 % |
| 46 | Georgia | 104 % |
| 47 | Poland | 100 % |
| 48 | Qatar | 100 % |
| 49 | Nicaragua | 99 % |
| 50 | Guinea | 98 % |
| 51 | Mozambique | 96 % |
| 52 | Timor-Leste | 95 % |
| 53 | Bosnia & Herzegovina | 95 % |
| 54 | Puerto Rico | 95 % |
| 55 | Congo - Kinshasa | 94 % |
| 56 | Kuwait | 94 % |
| 57 | Mauritania | 94 % |
| 58 | Congo - Brazzaville | 93 % |
| 59 | Morocco | 92 % |
| 60 | Gabon | 92 % |
| 61 | Greenland | 92 % |
| 62 | Honduras | 92 % |
| 63 | Greece | 90 % |
| 64 | Portugal its history → | 90 % |
| 65 | Moldova | 89 % |
| 66 | Iceland | 86 % |
| 67 | El Salvador | 86 % |
| 68 | South Korea | 85 % |
| 69 | Afghanistan | 84 % |
| 70 | Panama | 84 % |
| 71 | Finland | 84 % |
| 72 | Azerbaijan | 83 % |
| 73 | Lebanon | 82 % |
| 74 | Bermuda | 80 % |
| 75 | Ukraine its history → | 80 % |
| 76 | Norway | 80 % |
| 77 | Albania | 80 % |
| 78 | Bhutan | 79 % |
| 79 | Bahamas | 79 % |
| 80 | Germany its history → | 79 % |
| 81 | Romania | 77 % |
| 82 | Iraq | 77 % |
| 83 | Paraguay | 77 % |
| 84 | Mexico | 75 % |
| 85 | Palestine | 75 % |
| 86 | Equatorial Guinea | 74 % |
| 87 | Vanuatu | 73 % |
| 88 | Rwanda | 72 % |
| 89 | Spain its history → | 70 % |
| 90 | Costa Rica | 70 % |
| 91 | Botswana | 69 % |
| 92 | Ghana | 69 % |
| 93 | Senegal | 68 % |
| 94 | France its history → | 68 % |
| 95 | Philippines | 66 % |
| 96 | Canada | 65 % |
| 97 | Chile | 64 % |
| 98 | United Kingdom | 63 % |
| 99 | Italy | 63 % |
| 100 | Zambia | 63 % |
| 101 | South Africa | 62 % |
| 102 | Burkina Faso | 61 % |
| 103 | Togo | 60 % |
| 104 | Tajikistan | 59 % |
| 105 | Madagascar | 58 % |
| 106 | Uzbekistan | 58 % |
| 107 | Ecuador | 57 % |
| 108 | Kazakhstan | 57 % |
| 109 | Saudi Arabia | 56 % |
| 110 | Türkiye | 55 % |
| 111 | Israel | 54 % |
| 112 | Iran | 52 % |
| 113 | Dominican Republic | 52 % |
| 114 | Peru | 52 % |
| 115 | Uruguay | 52 % |
| 116 | Côte d’Ivoire | 51 % |
| 117 | New Zealand | 51 % |
| 118 | Angola | 50 % |
| 119 | Mali | 50 % |
| 120 | Guatemala | 47 % |
| 121 | Australia its history → | 47 % |
| 122 | Bolivia | 47 % |
| 123 | Central African Republic | 46 % |
| 124 | India its history → | 46 % |
| 125 | Japan | 45 % |
| 126 | Chad | 45 % |
| 127 | Indonesia | 43 % |
| 128 | Uganda | 43 % |
| 129 | Gambia | 42 % |
| 130 | Sri Lanka | 42 % |
| 131 | Malawi | 42 % |
| 132 | Zimbabwe | 42 % |
| 133 | Tanzania | 41 % |
| 134 | Benin | 41 % |
| 135 | Sierra Leone | 41 % |
| 136 | Guinea-Bissau | 40 % |
| 137 | New Caledonia | 40 % |
| 138 | Nepal | 40 % |
| 139 | Algeria | 40 % |
| 140 | Kenya | 40 % |
| 141 | Egypt | 40 % |
| 142 | Russia | 39 % |
| 143 | China | 38 % |
| 144 | Colombia | 36 % |
| 145 | Brazil | 36 % |
| 146 | Syria | 35 % |
| 147 | Cameroon | 34 % |
| 148 | Turkmenistan | 29 % |
| 149 | Argentina its history → | 28 % |
| 150 | Pakistan | 28 % |
| 151 | Bangladesh | 27 % |
| 152 | Venezuela | 26 % |
| 153 | United States | 25 % |
| 154 | Niger | 24 % |
| 155 | Haiti | 19 % |
| 156 | Ethiopia | 17 % |
| 157 | Sudan | 2 % |
21 countries or territories have no value that year.
Continent averages
| World (GDP-weighted average) | 56 % |
| Europe (average) | 81 % |
| Africa (average) | 53 % |
| Americas (average) | 35 % |
| Asia (average) | 52 % |
| Oceania (average) | 48 % |
Understanding this map
Small countries trade more
It is the clearest rule on this map: the more populous a country, the less it trades relative to its economy (correlation of −0.55 with population). A large country finds suppliers and customers at home; a small one cannot produce everything and sells a large share of what it makes. In 2024, the United States (25% of GDP), Brazil (36%), China (38%), Russia, Japan or India (39-46%) are among the least open; France is at 68%, Germany at 79%. At the other end, the Netherlands and Belgium (155-160%), Ireland (246%), Singapore, Hong Kong and Luxembourg (over 300%).
More than 100% of GDP?
Trade counts the full value of goods crossing the border, while GDP counts only value added in the country. A port such as Rotterdam, Antwerp or Singapore imports goods, transforms them little or re-exports them: the same goods are counted twice, coming in and going out. Ireland and Luxembourg add the flows of multinationals and finance. A high figure therefore does not mean that all of GDP goes abroad.
Globalisation in one line
Worldwide, trade went from about 27% of GDP in 1970 to over 60% in 2008: falling tariffs (GATT then WTO), containers, the opening of China and Eastern Europe. It then levelled off, with the 2009 crisis, Covid and trade tensions, at around 56-60%. Compare it, in the Correlations tool, with wealth or the Fraser Institute's “freedom to trade” score, which measures barriers (tariffs, quotas, capital controls) rather than volume.
Limits
World Bank data (national accounts), via Our World in Data. Europe counts trade between European countries, which makes it look more open than one large country. Gaps of five years or less are interpolated, and the last value is carried forward three years at most. World and continents: total trade over total GDP (GDP-weighted), when known countries make up at least 60% of the zone's GDP.
Sources : Banque mondiale, comptes nationaux, via Our World in Data (CC BY 4.0)
In the same theme : Wealth
All maps
Page updated on 2026-11-15.