Liberal democracy index
From 0 to 1: electoral democracy, plus what limits the power of those elected — independent judges, a parliament that oversees the government, equality before the law and individual liberties.
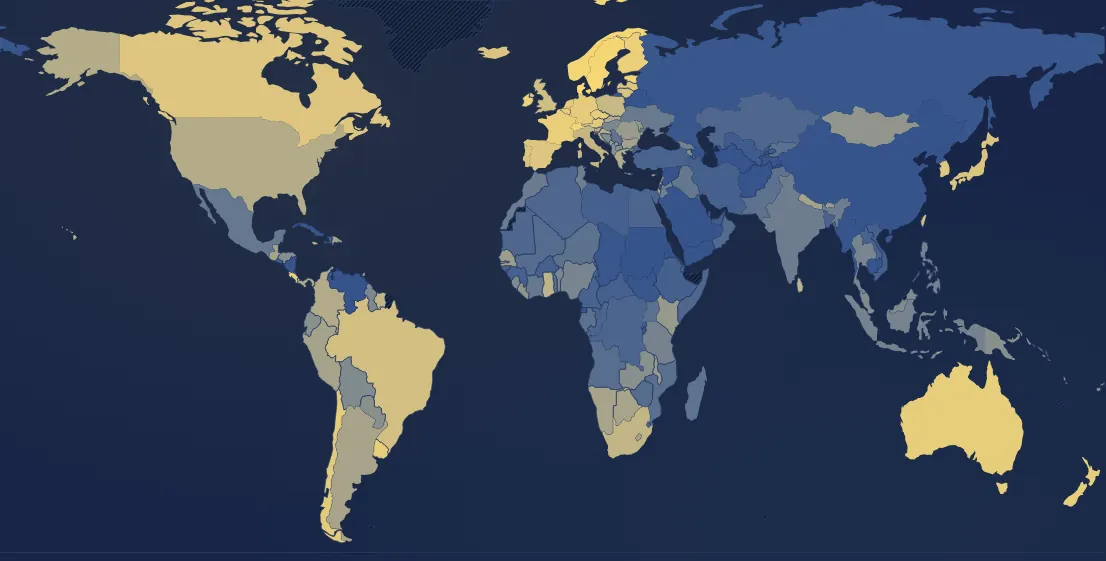
In 2025, 167 countries have a value. Highest: Denmark (0.88), Norway (0.85), Sweden (0.85). Lowest: North Korea (0.01), Myanmar (Burma) (0.01), Eritrea (0.01). World (population-weighted average): 0.27. France: 0.8 (9th of 167).
Country ranking in 2025
| Rank | Country | Value |
|---|---|---|
| 1 | Denmark | 0.88 |
| 2 | Norway | 0.85 |
| 3 | Sweden its history → | 0.85 |
| 4 | Switzerland its history → | 0.84 |
| 5 | Estonia | 0.84 |
| 6 | Ireland | 0.82 |
| 7 | Costa Rica | 0.81 |
| 8 | Finland | 0.81 |
| 9 | France its history → | 0.8 |
| 10 | Australia its history → | 0.79 |
| 11 | Belgium | 0.79 |
| 12 | Czechia | 0.79 |
| 13 | New Zealand | 0.79 |
| 14 | Uruguay | 0.79 |
| 15 | Chile | 0.78 |
| 16 | Germany its history → | 0.78 |
| 17 | Luxembourg | 0.78 |
| 18 | Netherlands its history → | 0.77 |
| 19 | Austria | 0.76 |
| 20 | Latvia | 0.75 |
| 21 | Canada | 0.74 |
| 22 | Spain its history → | 0.74 |
| 23 | South Korea | 0.74 |
| 24 | Japan | 0.73 |
| 25 | Iceland | 0.72 |
| 26 | Portugal its history → | 0.72 |
| 27 | Lithuania | 0.71 |
| 28 | Brazil | 0.7 |
| 29 | Taiwan | 0.7 |
| 30 | United Kingdom | 0.69 |
| 31 | Jamaica | 0.68 |
| 32 | Trinidad & Tobago | 0.67 |
| 33 | Cyprus | 0.66 |
| 34 | Poland | 0.65 |
| 35 | Italy | 0.64 |
| 36 | Suriname | 0.63 |
| 37 | South Africa | 0.63 |
| 38 | Malta | 0.62 |
| 39 | Vanuatu | 0.62 |
| 40 | Ghana | 0.61 |
| 41 | Sri Lanka | 0.61 |
| 42 | Croatia | 0.59 |
| 43 | Israel | 0.59 |
| 44 | Slovenia | 0.59 |
| 45 | Greece | 0.57 |
| 46 | Panama | 0.57 |
| 47 | Slovakia | 0.57 |
| 48 | United States | 0.57 |
| 49 | Colombia | 0.56 |
| 50 | Timor-Leste | 0.55 |
| 51 | Solomon Islands | 0.54 |
| 52 | Argentina its history → | 0.52 |
| 53 | Botswana | 0.52 |
| 54 | Gambia | 0.52 |
| 55 | Guatemala | 0.52 |
| 56 | Namibia | 0.52 |
| 57 | Dominican Republic | 0.51 |
| 58 | Lesotho | 0.51 |
| 59 | Nepal | 0.51 |
| 60 | Peru | 0.51 |
| 61 | Bulgaria | 0.5 |
| 62 | Montenegro | 0.5 |
| 63 | Senegal | 0.48 |
| 64 | Bhutan | 0.46 |
| 65 | Kosovo | 0.46 |
| 66 | Malawi | 0.46 |
| 67 | Romania | 0.46 |
| 68 | Kenya | 0.45 |
| 69 | Moldova | 0.45 |
| 70 | Liberia | 0.42 |
| 71 | Mongolia | 0.42 |
| 72 | Fiji | 0.4 |
| 73 | Ecuador | 0.39 |
| 74 | Albania | 0.38 |
| 75 | Honduras | 0.38 |
| 76 | Papua New Guinea | 0.38 |
| 77 | Paraguay | 0.38 |
| 78 | Zambia | 0.38 |
| 79 | Armenia | 0.37 |
| 80 | North Macedonia | 0.37 |
| 81 | Singapore | 0.36 |
| 82 | Bolivia | 0.35 |
| 83 | Malaysia | 0.35 |
| 84 | Sierra Leone | 0.35 |
| 85 | Bosnia & Herzegovina | 0.34 |
| 86 | Guyana | 0.33 |
| 87 | Benin | 0.32 |
| 88 | Hungary its history → | 0.32 |
| 89 | Nigeria | 0.31 |
| 90 | Thailand | 0.31 |
| 91 | Indonesia | 0.3 |
| 92 | Tanzania | 0.3 |
| 93 | Philippines | 0.29 |
| 94 | Georgia | 0.28 |
| 95 | Jordan | 0.27 |
| 96 | Lebanon | 0.27 |
| 97 | Tunisia | 0.27 |
| 98 | India its history → | 0.26 |
| 99 | Morocco | 0.25 |
| 100 | Ukraine its history → | 0.24 |
| 101 | Côte d’Ivoire | 0.23 |
| 102 | Iraq | 0.22 |
| 103 | Mexico | 0.22 |
| 104 | Serbia | 0.21 |
| 105 | Madagascar | 0.19 |
| 106 | Gabon | 0.18 |
| 107 | Kyrgyzstan | 0.18 |
| 108 | Niger | 0.18 |
| 109 | Pakistan | 0.18 |
| 110 | Mozambique | 0.17 |
| 111 | Uganda | 0.17 |
| 112 | Angola | 0.16 |
| 113 | Togo | 0.16 |
| 114 | Mali | 0.15 |
| 115 | Zimbabwe | 0.15 |
| 116 | Oman | 0.14 |
| 117 | Algeria | 0.13 |
| 118 | Kazakhstan | 0.13 |
| 119 | Kuwait | 0.13 |
| 120 | Mauritania | 0.13 |
| 121 | Somalia | 0.13 |
| 122 | Bangladesh | 0.12 |
| 123 | Congo - Kinshasa | 0.12 |
| 124 | Congo - Brazzaville | 0.12 |
| 125 | Djibouti | 0.12 |
| 126 | Egypt | 0.12 |
| 127 | Cameroon | 0.11 |
| 128 | Laos | 0.11 |
| 129 | Palestine | 0.11 |
| 130 | Türkiye | 0.11 |
| 131 | Burkina Faso | 0.1 |
| 132 | Central African Republic | 0.1 |
| 133 | Ethiopia | 0.1 |
| 134 | Guinea | 0.1 |
| 135 | Guinea-Bissau | 0.1 |
| 136 | Haiti | 0.1 |
| 137 | Iran | 0.1 |
| 138 | Libya | 0.1 |
| 139 | Eswatini | 0.1 |
| 140 | Vietnam | 0.1 |
| 141 | Qatar | 0.09 |
| 142 | Rwanda | 0.09 |
| 143 | El Salvador | 0.09 |
| 144 | United Arab Emirates | 0.08 |
| 145 | Uzbekistan | 0.08 |
| 146 | Burundi | 0.06 |
| 147 | Cuba | 0.06 |
| 148 | Russia | 0.06 |
| 149 | South Sudan | 0.06 |
| 150 | Chad | 0.06 |
| 151 | Azerbaijan | 0.05 |
| 152 | Equatorial Guinea | 0.05 |
| 153 | Cambodia | 0.05 |
| 154 | Saudi Arabia | 0.05 |
| 155 | Syria | 0.05 |
| 156 | Belarus | 0.04 |
| 157 | China | 0.04 |
| 158 | Tajikistan | 0.04 |
| 159 | Venezuela | 0.04 |
| 160 | Yemen | 0.04 |
| 161 | Sudan | 0.03 |
| 162 | Turkmenistan | 0.03 |
| 163 | Afghanistan | 0.02 |
| 164 | Nicaragua | 0.02 |
| 165 | Eritrea | 0.01 |
| 166 | Myanmar (Burma) | 0.01 |
| 167 | North Korea | 0.01 |
11 countries or territories have no value that year.
Continent averages
| World (population-weighted average) | 0.27 |
| Europe (average) | 0.49 |
| Africa (average) | 0.23 |
| Americas (average) | 0.52 |
| Asia (average) | 0.19 |
| Oceania (average) | 0.68 |
Understanding this map
Two nested indices
The site's main index (“electoral democracy”) combines five components: free and fair elections, freedom of expression and of the press, freedom of association, broad suffrage and rulers who actually come out of elections. The liberal democracy index adds what limits power once elected: oversight of the government by independent judges and by parliament, equality before the law and individual liberties. A country can vote freely and still see its checks and balances weakened: that is the gap between the two indices.
What the components show
The “Measure” buttons show each piece separately, and the tooltip gives them all for the country hovered. They show where a decline comes from. In Hungary, liberal democracy falls from 0.68 in 2010 to 0.32 in 2025: freedom of expression drops from 0.88 to 0.49, elections from 0.93 to 0.60, but equality before the law stays high (0.84). In the United States it falls from 0.85 to 0.57: the steepest decline is in congressional oversight of the government (0.95 → 0.61), then freedom of expression (0.96 → 0.73). France is stable (0.80; all components between 0.89 and 1). At the top in 2025: Denmark (0.88), Sweden, Norway.
Worldwide
Weighted by population, liberal democracy peaks around 0.39 in the early 2000s and falls back to 0.27 in 2025. Much of the decline comes from a few very populous countries, India above all (0.53 in 2010, 0.26 in 2025 according to V-Dem).
Limits
Same limits as the main index: expert assessments, with a margin of uncertainty, larger for the 19th century. The components do not simply add up: V-Dem combines them with a formula that penalises a country as soon as one piece is missing (an election without free speech is worth little). Suffrage is 1 almost everywhere today; it mostly sheds light on history.
Sources : V-Dem, jeu de données v16 (2026)
In the same theme : Democracy
All maps
Page updated on 2026-11-15.