Public spending on public order and safety (% of GDP)
What government spends in a year on police, courts, prisons and fire services, as a share of the wealth produced (GDP). OECD countries.
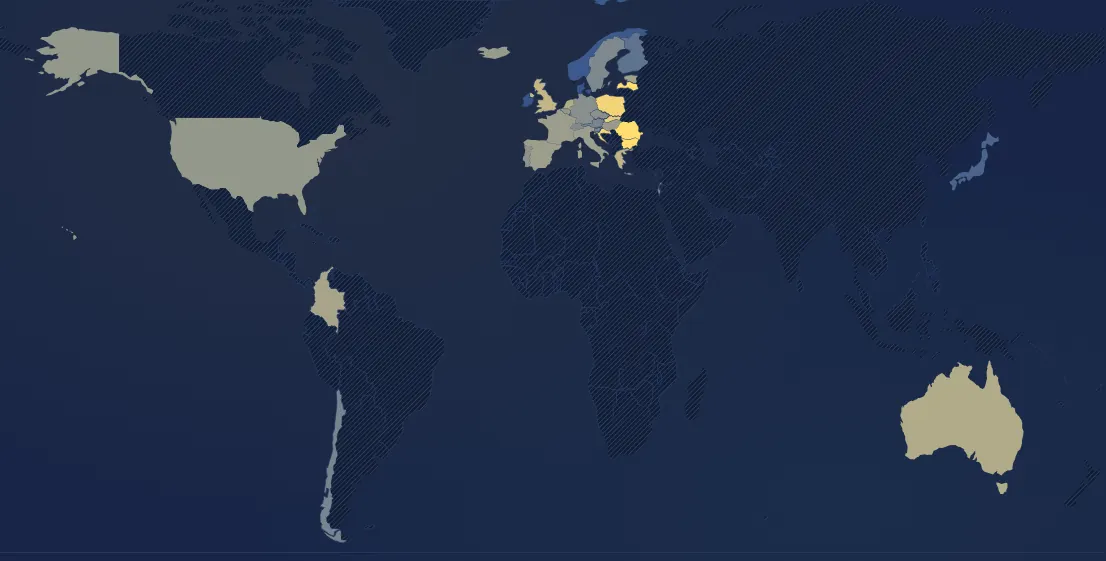
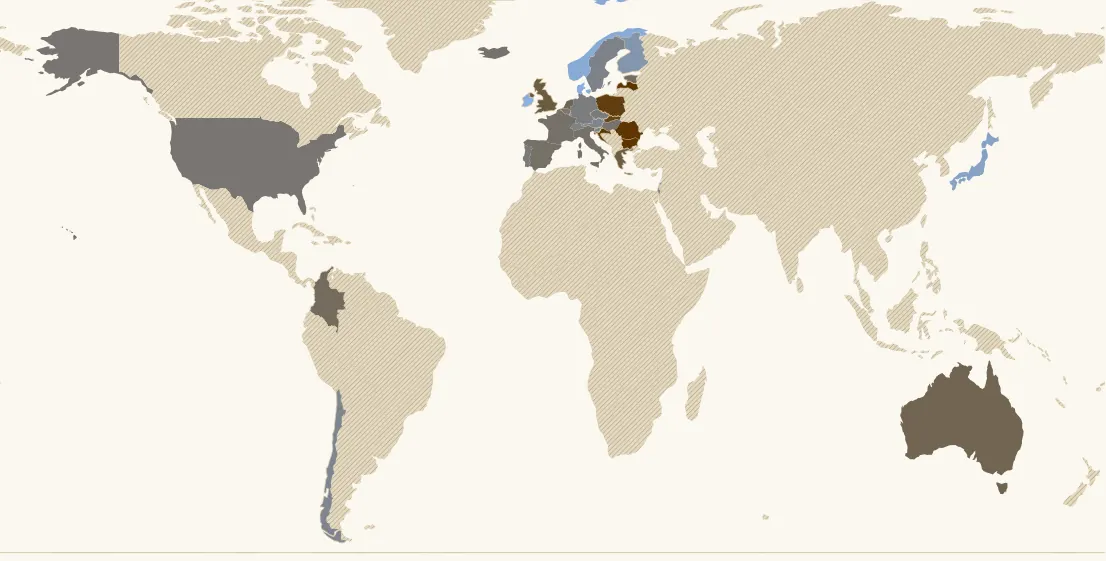
In 2024, 34 countries have a value. Highest: Latvia (3.1 %), Bulgaria (2.61 %), Romania (2.6 %). Lowest: Ireland (0.74 %), Denmark (0.98 %), Norway (1.05 %). France: 1.78 % (14th of 34).
Country ranking in 2024
| Rank | Country | Value |
|---|---|---|
| 1 | Latvia | 3.1 % |
| 2 | Bulgaria | 2.61 % |
| 3 | Romania | 2.6 % |
| 4 | Croatia | 2.44 % |
| 5 | Poland | 2.4 % |
| 6 | Slovakia | 2.32 % |
| 7 | United Kingdom | 2.06 % |
| 8 | Greece | 2.04 % |
| 9 | Australia its history → | 1.93 % |
| 10 | Netherlands its history → | 1.92 % |
| 11 | Colombia | 1.86 % |
| 12 | Estonia | 1.82 % |
| 13 | Spain its history → | 1.79 % |
| 14 | France its history → | 1.78 % |
| 15 | Italy | 1.78 % |
| 16 | Hungary its history → | 1.75 % |
| 17 | Iceland | 1.75 % |
| 18 | Belgium | 1.73 % |
| 19 | United States | 1.72 % |
| 20 | Portugal its history → | 1.67 % |
| 21 | Czechia | 1.65 % |
| 22 | Germany its history → | 1.63 % |
| 23 | Switzerland its history → | 1.58 % |
| 24 | Sweden its history → | 1.56 % |
| 25 | Slovenia | 1.54 % |
| 26 | Austria | 1.52 % |
| 27 | Chile | 1.51 % |
| 28 | Israel | 1.49 % |
| 29 | Finland | 1.32 % |
| 30 | Luxembourg | 1.29 % |
| 31 | Japan | 1.16 % |
| 32 | Norway | 1.05 % |
| 33 | Denmark | 0.98 % |
| 34 | Ireland | 0.74 % |
144 countries or territories have no value that year.
Understanding this map
What this figure measures
The international classification of government spending (COFOG) puts police, courts, prisons and fire services under “public order and safety”. The OECD publishes the share of each in public spending; here it is multiplied by public spending as a % of GDP (IMF). In OECD countries the total is 1 to 2.5% of GDP, a little over half of it for police and 0.1 to 0.8% for the courts.
More money, better justice?
Not according to these figures. In 2022, the countries whose justice is rated best (the “legal system and property rights” area of the Fraser index) spend the smallest share of GDP on their courts (r ≈ −0.7 across 33 countries): 0.10 to 0.22% in Japan, Norway, Denmark or Finland, 0.4 to 0.8% in Poland, Bulgaria, Croatia, Colombia or Costa Rica. The link holds every year since 2005 (r between −0.45 and −0.75) and with broader groupings that are less sensitive to classification differences (courts and prisons: r ≈ −0.6; all of “public order and safety”: r ≈ −0.5). Per person, spending more on courts has not gone with a better score since 2018 (r ≈ 0), and only slightly before (r ≈ 0.3). France spends 0.28% of GDP on them, like Switzerland, but $150 per person against $220 in Germany and $230 in Switzerland. Over time the link is a little more favourable: between 2007 and 2022, countries that raised their court budget per person tended to see their score improve (r ≈ 0.3 at equal growth), mostly in Eastern Europe (Bulgaria, Slovakia, Romania); France raised its budget by nearly a third and saw its score fall.
Limits
Countries do not all file the same spending under “courts” (ministry administration, legal aid, prosecution), and some charge litigants more. The link can run both ways: slow, unpredictable or unreliable justice produces more lawsuits, appeals and hearings, hence more spending, while justice that is too poor becomes slow in turn. Only OECD countries are covered; the United States does not publish the breakdown by function.
In the same theme : Public finances
All maps
Page updated on 2026-11-15.