Political corruption
From 0 to 1: how far officials, the government, members of parliament and judges take bribes or embezzle public money. 0 = no corruption, 1 = widespread corruption.
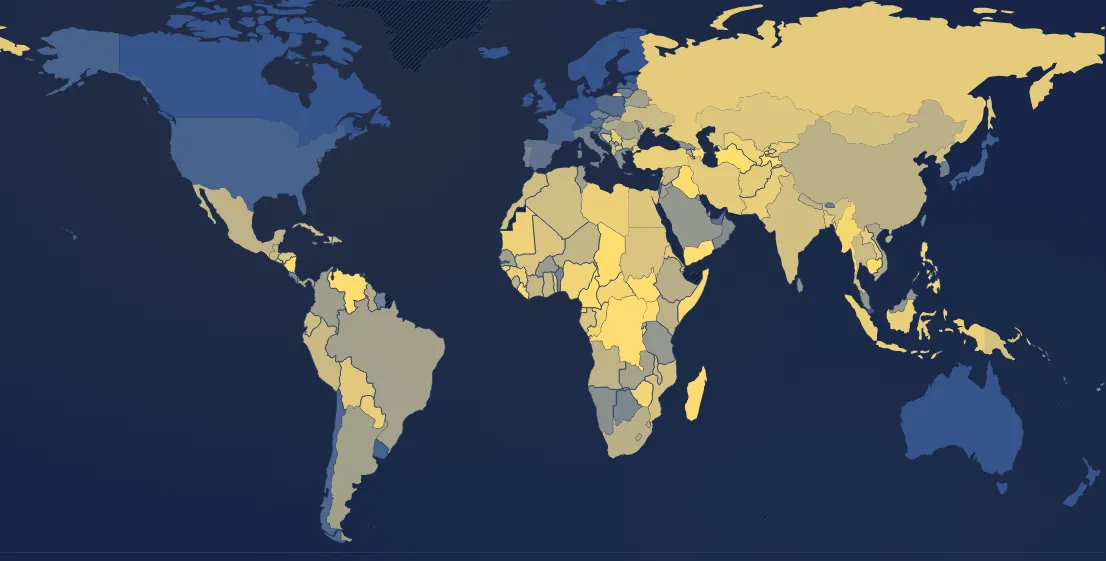
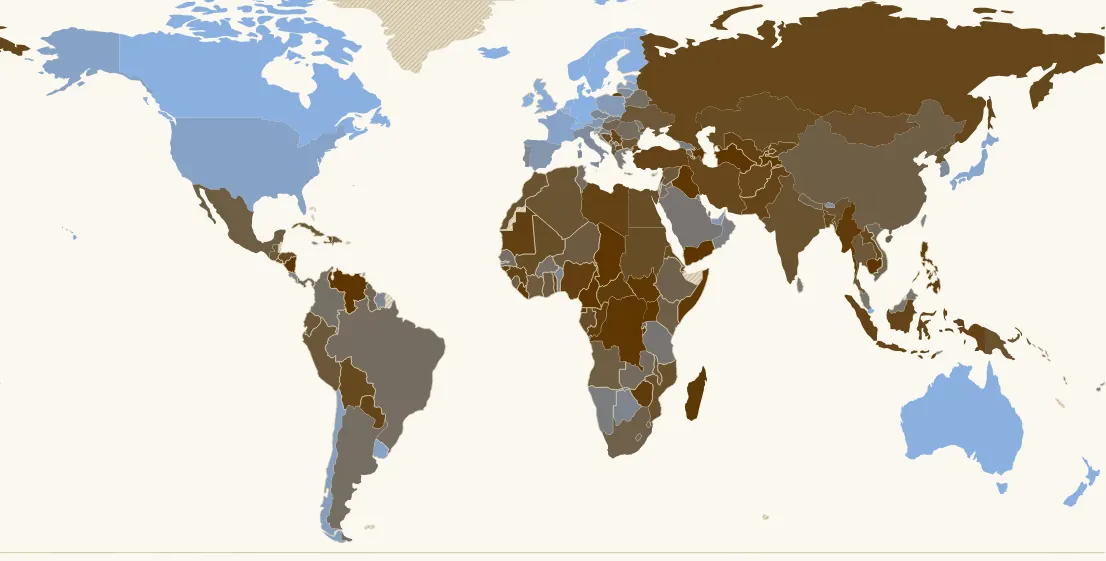
In 2025, 167 countries have a value. Highest: Venezuela (0.97), Chad (0.95), Cameroon (0.94). Lowest: Denmark (0), Sweden (0.01), Singapore (0.01). World (population-weighted average): 0.57. France: 0.06 (147th of 167).
Country ranking in 2025
| Rank | Country | Value |
|---|---|---|
| 1 | Venezuela | 0.97 |
| 2 | Chad | 0.95 |
| 3 | Cameroon | 0.94 |
| 4 | Nicaragua | 0.94 |
| 5 | Cambodia | 0.9 |
| 6 | Turkmenistan | 0.9 |
| 7 | Yemen | 0.9 |
| 8 | Azerbaijan | 0.89 |
| 9 | Congo - Kinshasa | 0.89 |
| 10 | Iraq | 0.89 |
| 11 | South Sudan | 0.89 |
| 12 | Tajikistan | 0.89 |
| 13 | Uganda | 0.89 |
| 14 | Liberia | 0.88 |
| 15 | Madagascar | 0.88 |
| 16 | Somalia | 0.87 |
| 17 | Equatorial Guinea | 0.86 |
| 18 | Myanmar (Burma) | 0.86 |
| 19 | Central African Republic | 0.85 |
| 20 | Zimbabwe | 0.85 |
| 21 | Burundi | 0.84 |
| 22 | Congo - Brazzaville | 0.84 |
| 23 | Philippines | 0.84 |
| 24 | Guinea-Bissau | 0.83 |
| 25 | Lebanon | 0.83 |
| 26 | Nigeria | 0.83 |
| 27 | Mauritania | 0.82 |
| 28 | Uzbekistan | 0.82 |
| 29 | Guinea | 0.81 |
| 30 | Libya | 0.81 |
| 31 | Indonesia | 0.8 |
| 32 | Pakistan | 0.8 |
| 33 | Paraguay | 0.8 |
| 34 | Türkiye | 0.8 |
| 35 | Haiti | 0.79 |
| 36 | Kyrgyzstan | 0.79 |
| 37 | Serbia | 0.79 |
| 38 | Bangladesh | 0.78 |
| 39 | Russia | 0.78 |
| 40 | Afghanistan | 0.77 |
| 41 | Iran | 0.77 |
| 42 | Laos | 0.77 |
| 43 | Bolivia | 0.76 |
| 44 | Togo | 0.76 |
| 45 | Eritrea | 0.75 |
| 46 | Honduras | 0.75 |
| 47 | North Macedonia | 0.75 |
| 48 | Kazakhstan | 0.74 |
| 49 | Bosnia & Herzegovina | 0.73 |
| 50 | Egypt | 0.73 |
| 51 | Gabon | 0.72 |
| 52 | Mali | 0.72 |
| 53 | Sudan | 0.72 |
| 54 | Djibouti | 0.71 |
| 55 | Mongolia | 0.69 |
| 56 | Mozambique | 0.69 |
| 57 | India its history → | 0.68 |
| 58 | Papua New Guinea | 0.68 |
| 59 | El Salvador | 0.68 |
| 60 | Morocco | 0.67 |
| 61 | North Korea | 0.67 |
| 62 | Algeria | 0.66 |
| 63 | Ecuador | 0.65 |
| 64 | Bulgaria | 0.64 |
| 65 | Cuba | 0.64 |
| 66 | Thailand | 0.64 |
| 67 | Ukraine its history → | 0.64 |
| 68 | Malawi | 0.63 |
| 69 | Peru | 0.63 |
| 70 | Albania | 0.62 |
| 71 | Guatemala | 0.62 |
| 72 | Syria | 0.62 |
| 73 | Ghana | 0.61 |
| 74 | Côte d’Ivoire | 0.6 |
| 75 | Solomon Islands | 0.6 |
| 76 | Dominican Republic | 0.59 |
| 77 | Niger | 0.59 |
| 78 | Angola | 0.57 |
| 79 | Mexico | 0.57 |
| 80 | Sierra Leone | 0.57 |
| 81 | Kenya | 0.56 |
| 82 | Nepal | 0.56 |
| 83 | China | 0.55 |
| 84 | Eswatini | 0.55 |
| 85 | South Africa | 0.54 |
| 86 | Ethiopia | 0.53 |
| 87 | Guyana | 0.51 |
| 88 | Hungary its history → | 0.49 |
| 89 | Panama | 0.48 |
| 90 | Armenia | 0.47 |
| 91 | Lesotho | 0.47 |
| 92 | Vietnam | 0.47 |
| 93 | Palestine | 0.46 |
| 94 | Montenegro | 0.43 |
| 95 | Zambia | 0.43 |
| 96 | Brazil | 0.42 |
| 97 | Jordan | 0.42 |
| 98 | Romania | 0.42 |
| 99 | Rwanda | 0.42 |
| 100 | Argentina its history → | 0.41 |
| 101 | Belarus | 0.41 |
| 102 | Tunisia | 0.41 |
| 103 | Senegal | 0.4 |
| 104 | Colombia | 0.39 |
| 105 | Burkina Faso | 0.37 |
| 106 | Kosovo | 0.35 |
| 107 | Kuwait | 0.35 |
| 108 | Moldova | 0.33 |
| 109 | Qatar | 0.33 |
| 110 | Saudi Arabia | 0.33 |
| 111 | Tanzania | 0.33 |
| 112 | Vanuatu | 0.33 |
| 113 | Malaysia | 0.32 |
| 114 | Fiji | 0.29 |
| 115 | Georgia | 0.29 |
| 116 | Slovakia | 0.29 |
| 117 | Greece | 0.28 |
| 118 | Sri Lanka | 0.28 |
| 119 | Gambia | 0.27 |
| 120 | Namibia | 0.27 |
| 121 | Croatia | 0.25 |
| 122 | Oman | 0.25 |
| 123 | Timor-Leste | 0.25 |
| 124 | Costa Rica | 0.21 |
| 125 | Jamaica | 0.21 |
| 126 | Taiwan | 0.21 |
| 127 | Botswana | 0.2 |
| 128 | Benin | 0.19 |
| 129 | Malta | 0.19 |
| 130 | Cyprus | 0.17 |
| 131 | Czechia | 0.17 |
| 132 | Portugal its history → | 0.17 |
| 133 | Suriname | 0.17 |
| 134 | Italy | 0.16 |
| 135 | South Korea | 0.16 |
| 136 | Lithuania | 0.16 |
| 137 | Bhutan | 0.15 |
| 138 | Spain its history → | 0.11 |
| 139 | Israel | 0.11 |
| 140 | United Arab Emirates | 0.1 |
| 141 | Austria | 0.1 |
| 142 | Trinidad & Tobago | 0.1 |
| 143 | Poland | 0.08 |
| 144 | Slovenia | 0.08 |
| 145 | Chile | 0.07 |
| 146 | Latvia | 0.07 |
| 147 | France its history → | 0.06 |
| 148 | Uruguay | 0.06 |
| 149 | United States | 0.06 |
| 150 | Japan | 0.05 |
| 151 | United Kingdom | 0.04 |
| 152 | Australia its history → | 0.03 |
| 153 | Belgium | 0.03 |
| 154 | Canada | 0.03 |
| 155 | Estonia | 0.03 |
| 156 | Finland | 0.03 |
| 157 | Ireland | 0.03 |
| 158 | Luxembourg | 0.03 |
| 159 | Netherlands its history → | 0.03 |
| 160 | Switzerland its history → | 0.02 |
| 161 | Germany its history → | 0.02 |
| 162 | Iceland | 0.01 |
| 163 | Norway | 0.01 |
| 164 | New Zealand | 0.01 |
| 165 | Singapore | 0.01 |
| 166 | Sweden its history → | 0.01 |
| 167 | Denmark | 0 |
11 countries or territories have no value that year.
Continent averages
| World (population-weighted average) | 0.57 |
| Europe (average) | 0.34 |
| Africa (average) | 0.68 |
| Americas (average) | 0.35 |
| Asia (average) | 0.63 |
| Oceania (average) | 0.2 |
Understanding this map
What the index measures
This is V-Dem's political corruption index, built by the same experts as the democracy index but not part of it. It combines six questions: do officials accept bribes, do they embezzle funds? And the same for the government, members of parliament and judges. Unlike Transparency International's perception index (since 1995), it goes back to 1789.
What it shows
In 2025 the least corrupt countries are Denmark, Iceland, Norway, New Zealand, Singapore and Sweden; the most corrupt Venezuela (0.97), Chad, Nicaragua, Cameroon, Yemen. France is at 0.06, like the United States; it was at 0.17 in 1800 and 0.13 in 1930. Hungary is at 0.49, Russia at 0.78. Corruption often goes with poverty and a lack of checks and balances; Singapore, barely corrupt without being a democracy, is an exception. Compare in the Correlations tool.
Limits
Corruption hides: these scores rest on expert judgement, not on court cases, and their margin of uncertainty is large, especially for the past. The index covers political and administrative corruption, not tax fraud or corruption between private firms. World average weighted by population: China and India weigh heavily.
Sources : V-Dem, jeu de données v16 (2026)
Articles
In the same theme : Democracy
All maps
Page updated on 2026-11-15.